Aug 01, 2014
Eurex
An introduction to the VSTOXX® Option smile
This article presents an analysis of the VSTOXX® smile, which is a fundamental building block for studying the behavior of the VSTOXX®. It is the first in a series and will use the insight gained from the VSTOXX® smile as a starting point in follow-up articles to go beyond the VSTOXX® futures and options into “vol of vol” and other important building blocks for the VSTOXX® in addition to pure volatility.
Eurex Exchange offers futures and options on the VSTOXX®, which give investors a targeted and leveraged means to take a view on European volatility. Liquidity and open interest in the VSTOXX® volatility derivatives has grown and its status as the Eurozone’s benchmark “fear gauge” has solidified. As a result, it has become an increasingly relevant risk management tool for investors and traders who have exposure to European equities and for those looking to trade volatility on a global basis.
The VSTOXX® expresses the fluctuation range expected by the market, and which is embedded in the implied volatility of the EURO STOXX 50® Index Options. It indicates in percentage points which volatility is to be expected for the EURO STOXX 50® Index over the coming 30 days. The basis of calculation for this index is a broad basket of EURO STOXX 50® Index Options quoted at-the-money or out-of-the-money. It is typically derived from the 1st two option expiries to bracket a rolling 30-day period.
The research upon which this article is based used VSTOXX® option settlement prices for the time period from March 2010 through January 2014, i.e. from the options’ initial listing date and covering the time period during which VSTOXX® achieved its benchmark status. The time period is also highly interesting given elevated volatility due to the European sovereign debt crisis that was accompanied by numerous mini spikes and led to higher price levels in the VSTOXX® index and VSTOXX® options.
Using a Black-Scholes model, the VSTOXX® Options prices were transformed into the respective implied volatility of the VSTOXX® Options. A parabolic fit in a moneyness range between 60 percent and 140 percent was used to fit the smile for each maturity. The fit allowed to then read off measures like at-the-money (ATM) implied volatility, ATM implied skew (slope) and ATM implied kurtosis (curvature) of every VSTOXX® Option maturity.
Significant differences: equity option volatility versus the volatility of VSTOXX® Options
Below left is a representative graph of the volatility smile for a generic equity option. Investors in equity options are familiar with the graph in which out-of-the-money options typically feature higher implied volatility levels on the up and downside. Below right is a depiction of the VSTOXX® Options smile. We plot these representative smile graphs next to each other in order to demonstrate their significant differences.
Equity options smile

VSTOXX® options smile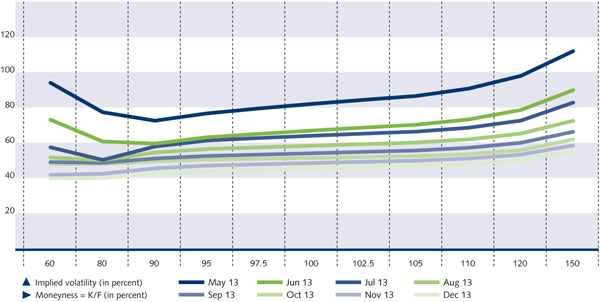
The VSTOXX® Options smile graph is familiar to volatility traders yet it is new for equity options traders. For regular equity options, investors worry about potential sell-offs and downside moves. Due to this additional demand for downside protection, the downside puts are automatically driven up in price. In contrast, a volatility trader is more concerned about the ‘fear characteristics’ of the underlying: volatility spikes when something happens – especially a sell-off in the equity market. A volatility trader will therefore value up-side protection in volatility more and pay a premium for VSTOXX® calls. Our data indicates that 99 percent of the smiles showed this “hockey stick form” over the sample time period - a positive slope (skew). In the end, we have an inverse relationship for the VSTOXX® Option smile in comparison to the typical equity option smile.
Volatility traders value up-side protection more and pay a premium for VSTOXX® calls.
At-the-Money (ATM) implied volatility: a view on future volatility
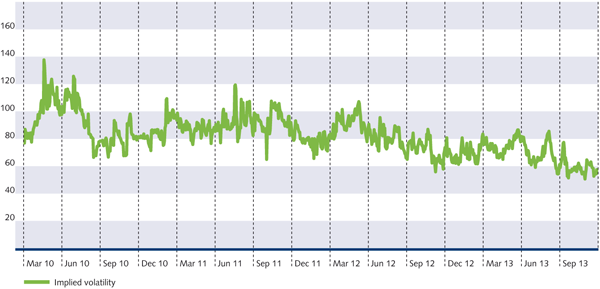
It is easy to construct various measures with the fitted parabola at hand. The first one we explored is ATM implied volatility. Using the two nearby maturities we interpolate in time to expiration to construct a thirty-day rolling index. This 30-day ATM implied volatility of VSTOXX® Options is depicted below. The graph shows how volatility decreased over the time period analyzed, which is consistent with the recovery in equity markets.
VSTOXX 30-day ATM Implied volatility
Skew: a magnifying glass on the direction and strength of fluctuations in the VSTOXX®
Finally, we can determine the slope of the hockey stick – the implied ATM skew. The following graph of the 30-day rolling ATM VSTOXX® implied skewness tells the story of volatility from March 2010 until January 2014, which includes an extremely volatile time in the financial markets. The graph is a magnifying glass on the uncertainty in the markets, or the fluctuations in the VSTOXX® Options. 99 percent of the time, the VSTOXX® skew was positive indicating that a rise in the VSTOXX® Index automatically triggered a rise in the volatility level implied out of VSTOXX® Options.
99 percent of the time, the VSTOXX® skew was positive indicating that people worry more about the upside movements of the volatility index.
Kurtosis: insight into the overall distribution of the volatility of VSTOXX®
Looking beyond the level of the ATM point and the strength of the ATM skew we can also explore the curvature of the VSTOXX® Option smile. We found that in about one third of the times the curvature was upside down or facing downwards: the smile turned into a frown. The following graph depicts the implied ATM kurtosis (curvature) for the sample period. The smaller kurtosis at the beginning of the time series indicates that investors were concerned about unexpected, outsized moves in far-out strike prices. As the market recovered, that concern diminished and kurtosis rose, indicating greater complacency.
VSTOXX 30-day ATM implied volatility Kurtosis
Related trading strategies
The elevated implied volatility levels for VSTOXX® strike prices on the upside highlight the risk premium paid for calls that are subject to the jumpy nature of the VSTOXX®. This property is frequently used by market participants in a targeted fashion with 2 by 1 ratio call spreads. This strategy typically features a reduced premium outlay for a positive exposure to moves on the upside within the strike range traded. In VSTOXX® Options, the premium for call ratio spreads is not only reduced but can even be flat due to the steepness of the VSTOXX® Options volatility smile. The position benefits from higher VSTOXX® levels up to the level of the sold strikes. In addition, it also profits from the increase in the volatility of the VSTOXX® itself by virtue of the positive implied skewness.
2 by 1 ratio call spreads profit from elevated implied volatility levels for VSTOXX® strike prices on the upside.
Summary and conclusion
In this article we deconstructed the volatility smile implied in VSTOXX® Options in terms of ATM implied volatility, ATM implied skewness and ATM implied kurtosis. Thirty-day rolling time series of these measures were constructed. We showed how these properties might be included into a trading strategy. The volatility of volatility as analyzed for VSTOXX® Options features key differences to the risk properties of more traditional equity or index options. These are interesting from an analytical perspective and offer insights into derivatives pricing nuances for options on the VSTOXX® that can be utilized for risk evaluation and market positioning.
The next article in this series will investigate a different approach, implied variance, to the calculation of volatility of the VSTOXX® index. It will then compare implied volatility and implied variance and discuss applications for both approaches.
Eurex Exchange would like to thank the Program for Financial Mathematics of University of Chicago for its analysis.
Rex Jones, Product Development, Eurex
Rex Jones is product developer for derivatives. Joining Eurex in 2001 he first worked as Sales Specialist in Index Derivatives, moving to Product Development in 2003.
Rex develops product and system enhancements with traders and investors, and seeks out market maker support that matches end-user demand. Rex was responsible for the launch of option strategy trading at Eurex. His most recent products are VSTOXX Futures and Options, benchmarks for European volatility.
Rex holds a degree in Business Administration from the Goethe University in Frankfurt, Germany.
Axel Vischer
Product Research and Development, Eurex
Axel Vischer is responsible for Eurex Product Research and Development in the US. Most recently, he served as Vice President of the Eurex Executive Office and Senior Analyst, Corporate Initiatives at the International Securities Exchange (ISE), a wholly owned Eurex subsidiary. His hybrid role helped ensure that both companies’ initiatives were aligned from a strategic standpoint.
He started his financial career at Salomon Brothers in Frankfurt as a quantitative analyst. He later joined EFOT, a trading boutique founded by a group of ex-Salomon traders, where he was responsible for the development of derivatives strategies and risk management.
Dr. Vischer holds a Ph.D. in Theoretical Nuclear Physics from Oregon State University, where he studied as a Fullbright scholar. He spent several years in research both at the University of Minnesota and the Niels-Bohr Institute in Copenhagen. He currently resides in Chicago with his wife and three children.