Jul 09, 2026
Eurex
Eurex Credit Index Futures market review: H1 2026
European credit markets remained resilient amid elevated volatility, driving increased adoption of Eurex Credit Index Futures for risk management, beta benchmarking, and taking advantage of dislocations across macro credit products.
Macroeconomic backdrop
In the first half of 2026, the European credit market demonstrated remarkable resilience against a highly challenging backdrop of sticky inflation and persistent geopolitical shocks. Rising energy prices pushed headline euro area inflation to a stubborn 3.2% in May, prompting the European Central Bank (ECB) to raise interest rates by 25 basis points to 2.25% in June. This hawkish policy tightening occurred even as economic momentum softened, with annual euro area GDP growth forecasts slowing to a sluggish 0.5%, pointing to an uncertain macroeconomic picture in the second half of 2026.
European credit market review
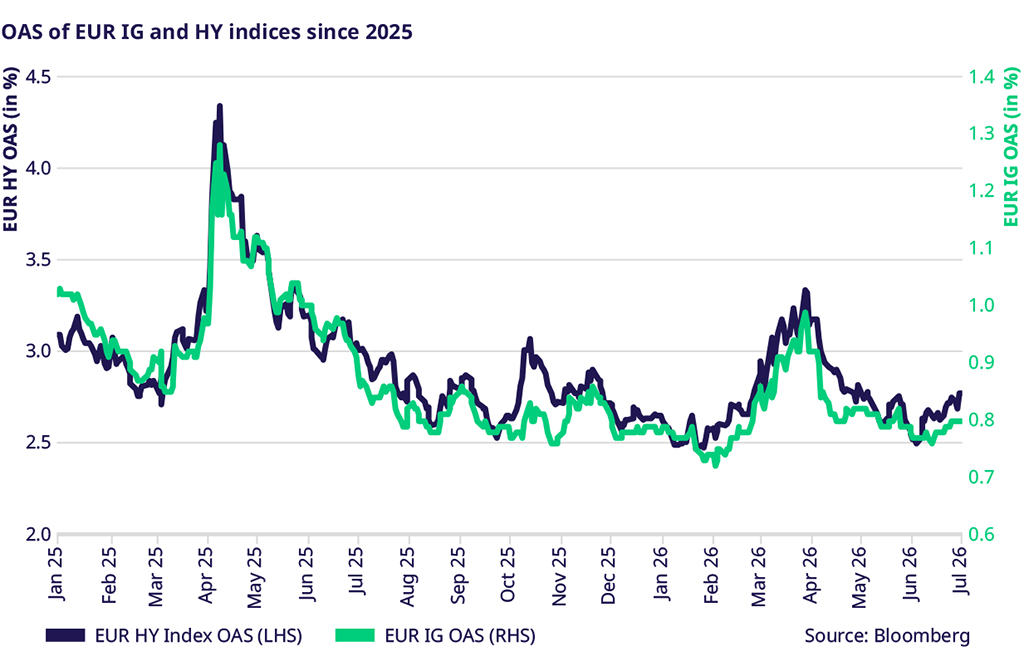
Despite a highly volatile early spring that saw the Bloomberg Euro Aggregate Corporate and Pan-European High Yield (Euro) Average OAS indices spike to 98 and 333 basis points, respectively, on geopolitical fears, the credit market staged a swift and robust recovery. By late May and June, risk premiums had compressed significantly. At the end of June, Investment Grade (IG) OAS over sovereign curve tightened to 80 basis points, while High Yield (HY) OAS settled near historical lows of approximately 269 basis points. This stabilization indicated that investors successfully decoupled from immediate macro anxieties, choosing instead to focus on resilient corporate balance sheets and highly attractive yields.
Technical support and supply dynamics
Strong technical dynamics underpinned this market recovery, even in the face of record-breaking primary supply. By June, the amount of notional outstanding in the Bloomberg Euro High Yield Index benchmark saw a net increase of EUR 27bn between January and the end of June 2026 (+7.71% year to date). Respectively, the amount of notional outstanding in the Bloomberg Euro Corporate Aggregate Index rose by EUR 100bn (+3.4% year to date) over the same period. While such an unprecedented wall of supply might typically have pressured spreads wider, it was readily absorbed by the market. This demand was driven by a combination of heavy institutional cash reserves and a late-spring rebound in retail fund inflows. These liquidity sources provided a strong technical bid, ensuring the market closed the first half of 2026 on exceptionally stable ground. Ultimately, the first half of 2026 proved that despite tightening monetary policy and slow growth, European credit remained a highly favored destination for capital.
Eurex Credit Index H1 highlights
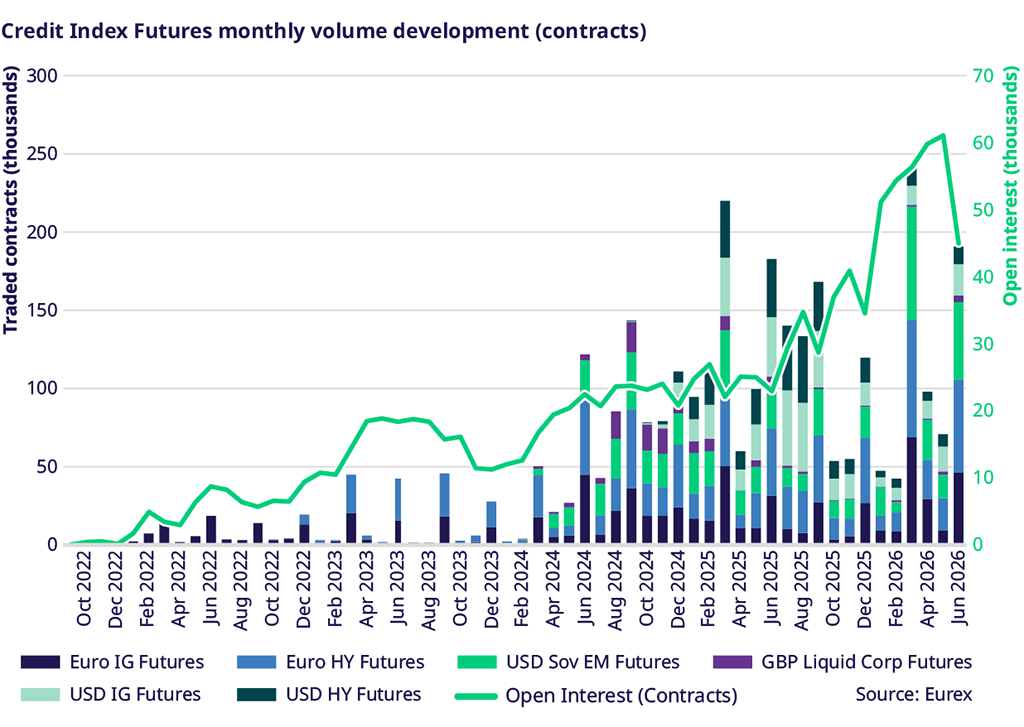
- About 700,000 contracts traded in first half of 2026 (EUR 55 billion)
- Over 3,000,000 contracts have been traded since inception (EUR 248 billion)
- Open Interest peaked at over 60,000 contracts in May 2026 (over EUR 5 billion)
- Eurex Credit Index Futures proved to be essential risk management tools during highly volatile periods
- Client activity grew significantly, with over 110 active end-users and block trades in the first half of 2026 exceeding the entirety of 2025 activity
Eurex Credit Index H1 product reviews
- EURO Investment Grade Futures (FECX): Eurex Euro IG futures average daily volume (ADV) maintained a steady baseline of roughly 1,375 contracts (equivalent notional traded of EUR 238 million per day) throughout the first half of 2026 with a March spike to 3,151 (equivalent notional traded of EUR 538 million per day) contracts. Driven by geopolitical oil shocks and "higher-for-longer" rate fears, institutional investors turned to Eurex's liquid contract to dynamically hedge credit portfolio risk. Despite tightening spreads, Eurex IG futures served as the primary exchange-traded gateway for rapid defensive positioning, proving vital during acute fixed-income stress.
- EURO High Yield Futures (FEHY): In 2026, Eurex Euro HY futures ADV grew from 1,534 contracts (equivalent notional traded of EUR 95 million per day) in Q1 to 1,689 contracts (equivalent notional traded of EUR 107 million per day) at the close of Q2. While geopolitical oil shocks persisted and high-yield spreads unexpectedly tightened, severe under-the-surface vulnerabilities and divergent default risks emerged, especially in the private credit space. Institutional investors continued to turn to Eurex's liquid HY contracts to dynamically hedge leveraged portfolio exposures, driving a prolonged, multi-month wave of tactical credit protection.
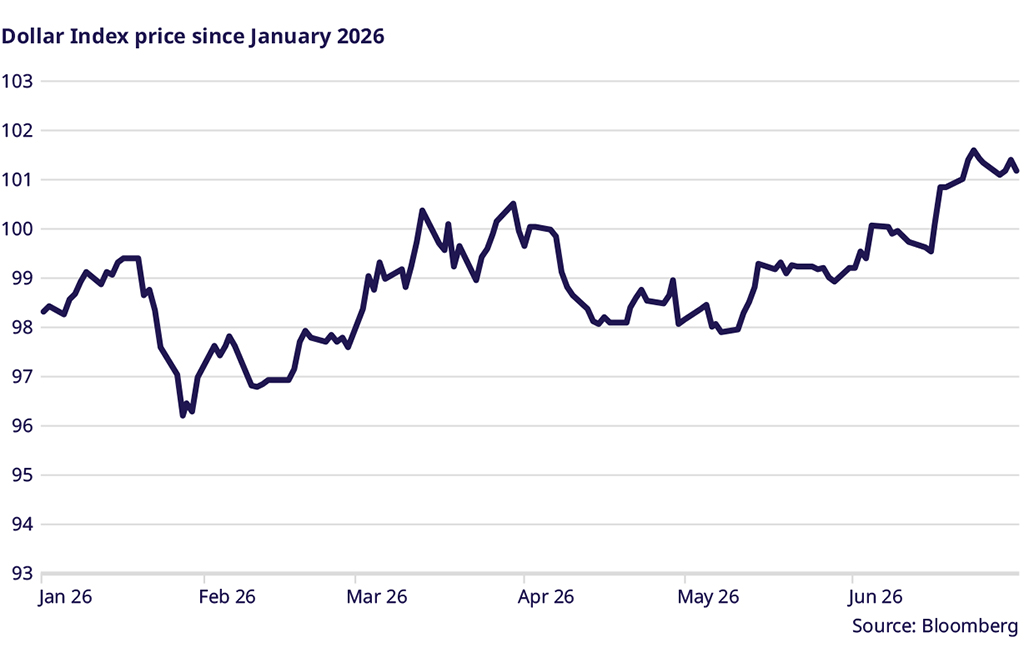
- USD Emerging Market Sovereign Futures (FUEM): Eurex USD EM Sovereign futures ADV averaged at 1,562 contracts (equivalent notional traded of USD 41 million per day) in the first half of 2026, with a spike in March of 3,290 contracts a day (equivalent notional traded of USD 86 million per day). This surge was driven by compounding macro headwinds. As rising US Treasury yields and a strong dollar worsened financing conditions for developing nations, EM sovereign spreads unexpectedly tightened. To navigate this uneven market, institutional investors continued to turn to Eurex EM futures to adjust their risk.
Surge in block trade activity
In the first half of 2026, Eurex block trading experienced a significant surge in both transaction volume and capital flow, indicating highly active institutional liquidity. The first quarter of 2026 registered 552 block trades, marking an explosive 157.9% year-on-year increase compared to the 214 trades executed in the first quarter of 2025. This momentum carried into the second quarter of 2026, which recorded a peak of 576 trades, representing a substantial 167.9% year-on-year increase over the 215 trades completed in the second quarter of 2025. This high volume of execution was matched by a substantial amount of capital, with the total traded notional equivalent reaching EUR 14.11 billion in the first quarter of 2026 and peaking at EUR 14.33 billion in the second quarter of 2026.
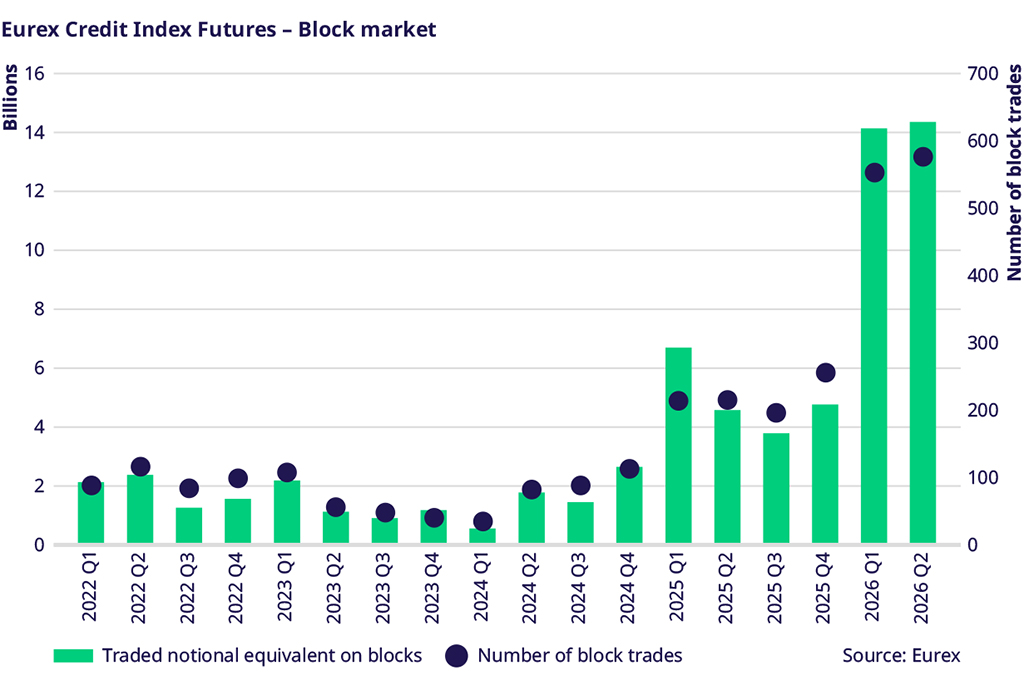
Crucially, this volume was driven by highly substantial transaction sizes rather than fragmented activity. The average notional traded per block stood at a robust EUR 25.57 million in the first quarter of 2026. This average remained stable into the second quarter, dipping only slightly to EUR 24.88 million. Across the entire six-month period, institutional players executed 1,128 block trades totaling over EUR 28.44 billion in notional value, demonstrating sustained, heavy institutional block-trading activity on the exchange.
Open positions development in 2026
During the first half of 2026, Eurex Credit Index Futures saw a meaningful increase in agency open positions. This was driven by a combination of new clients using the products and increased activity from existing participants.
The spike in volatility in March 2026 encouraged buy-side clients to use Credit Index Futures as an additional tool to gain or reduce unfunded exposure to corporate bond markets. The products were also used to hedge credit portfolios during periods of geopolitical stress, including market uncertainty linked to the Iran-U.S. conflict.
In March 2026, net positioning in agency accounts shifted from overall long to overall short across Credit Index Futures. This repositioning was supported by on- and off-book liquidity providers, who continued to facilitate large risk-transfer transactions during volatile market conditions. Overall, the product suite traded 240,000 contracts in March (equivalent to close to EUR 20 billion in notional traded), marking an all-time monthly record for Eurex Credit Index Futures.
The rapid buildup of short positions contributed to a significant increase in open interest, which exceeded 60,000 contracts across April and May 2026 (equivalent to approximately EUR 5 billion in notional terms).
As Euro credit spreads normalized and reached tighter levels in June, the need to maintain short hedging positions declined. Open interest therefore moved lower by the end of June, reaching approximately 45,000 contracts as some clients allowed short positions to expire.