Dec 06, 2016
Eurex Exchange
VSTOXX®/VIX volatility spread behavior during recent volatility events
In past articles I’ve discussed the various behaviors of the VSTOXX®/VIX spread. This article follows my last article “Utilizing a European volatility index for Pan-European volatility” examining VSTOXX® behavior in recent volatility events relative to various European equity indexes.
The Brexit election and the U.S. election are now behind us. Several European elections are on the horizon in 2017. And there doesn’t seem to be a shortage of ideas being discussed for potential future macro volatility events. This article examines the behavior of the VSTOXX®/VIX spread during recent volatility events. Could the understanding of the spread’s behavior during past volatility events offer some insight for future events?
Liquidity is always important to an investor or trader. Table 1 gives readers an overview of the VSTOXX® Futures liquidity over the last years.
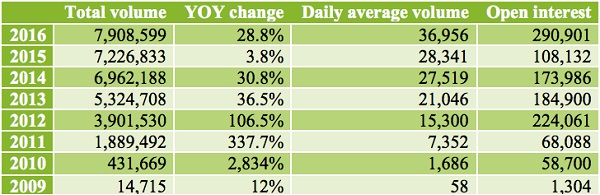
Table 1: VSTOXX® Futures yearly volume and open interest as of October 2016
Source: Eurex Exchange monthly statistics
Trading a spread is just another way of saying trading relative value. An investor is simply going long one product and short another product as they are seeking the spread price or price differential between the two products to either widen or narrow based on the position they are holding.
In the case of the VSTOXX®/VIX spread a trader may go long VSTOXX® Futures and short VIX futures when the spread price is oversold or sitting at or near the bottom of the range. A trader may sell VSTOXX® Futures and buy VIX futures when the spread is near the high end of the range or considered overbought and finding resistance.
Since 2 January 2007, the VSTOXX®/VIX spot spread averages an estimated premium of 4.5 volatility points of VSTOXX® over VIX. The spread has traded below 2 about 19 percent of the time. The spot spread trades at negative prices about 7 percent of the time. Therefore it is a low probability for the spread to remain negative for an extended period of time. When the spread is negatively priced it tends to be more of a spike versus a sustained period of time.
When the VSTOXX®/VIX spread rallies it also tends to spike to the upside and it usually doesn’t sustain high price levels for extended periods of time. Since 2007, the spot spread price has been above 8, 11 and 14 about 14 percent, 3 percent and 0.7 percent of the time respectively. Just prior and during the financial crisis was the only period since 2007 the spread remained negative for a prolonged period of time as noted in Chart 1.
Often, when the VSTOXX®/VIX spread widens, it is due to one of the below items occurring:
- EURO STOXX 50® Index declines, causing VSTOXX® Volatility index to rally while the VIX may remain relatively stable thus causing a widening spread price.
- S&P 500 index rallies causing the VIX index to decline while VSTOXX® remains relatively stable equating to a widening spread.
- S&P 500 index declines and the EURO STOXX 50® Index declines causing both the VSTOXX® and VIX indexes to rally. However, VSTOXX® will often rally at an accelerated rate versus VIX thus widening the spread.
The VSTOXX®/VIX spread may be utilized as a sentiment indicator. If the spread is oversold or overbought it could give an indication of how the individual volatility indexes may behave in the near future to either narrow or widen the spread price. A second derivative analysis of the spread may imply that if the volatility indexes should move, it could be a signal for direction of the respective underlying equity markets. For example if the spread is priced above 11, it would be considered very wide with an increased probability for either VSTOXX® Futures or VIX futures to move to narrow the spread and what that may imply about the underlying equity market.
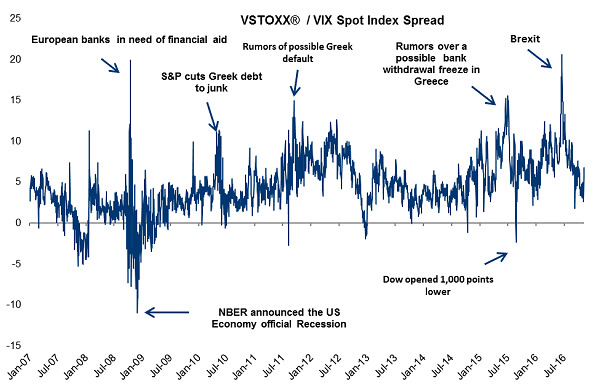
Chart 1: Spread price of VSTOXX®/VIX spot index spread 1 January 2009 to 9 November 2016
Source: Bloomberg data
Chart 2 shows the spot price of VSTOXX® and VIX indexes along with VSTOXX®/VIX spot spread. This gives a macro picture of how the VSTOXX®/VIX spread has behaved over time. The spread tends to widen when the underlying volatility indexes rally.
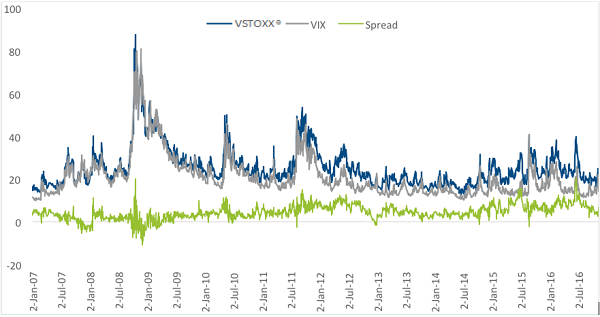
Chart 2: Daily spot price of VSTOXX® and VIX indexes and VSTOXX®/VIX spot spread 2 Jan 2007 to 9 Nov 2016
Source: Bloomberg data
Chart 3 observes the 2008 rally of the volatility indexes while the spread was frequently negative during that time. This is one of the few times the VSTOXX®/VIX spread sustained a negative price for an extended period of time. Chart 3 also shows when the volatility indexes have large moves, the spread tends to remain within a range that is relatively common within its price distribution. As the volatility indexes gradually drifted lower in 2009, the spread was still hovering around the low single digits.
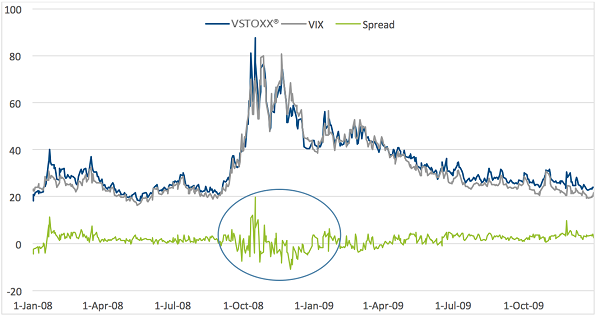
Chart 3: VSTOXX®/VIX daily spot spread price 2 January 2008 to 31 December 2009
Source: Bloomberg data
Table 2 lists the average, median, maximum and minimum VSTOXX®/VIX spread price and the frequency of how often the spread price is either above or below a specific spread price. For example, 0.8 percent of the time the spot spread price is above 14. The pricing and the frequency of spot versus futures VSTOXX®/VIX spreads are similar. VSTOXX® Futures began trading 2 June 2009, which is the starting date of this analysis to compare the spread statistics of the spot price to the futures price.

Table 2: Statistics of daily spot and front month futures of VSTOXX®/VIX spread 2 June 2009 to 9 November 2016
Source: Bloomberg data
Chart 4 shows the daily prices of VSTOXX® Futures, VIX futures and VSTOXX® Futures/VIX futures spread since inception of the VSTOXX® Futures contract. It is very similar to the spot prices in Chart 2.
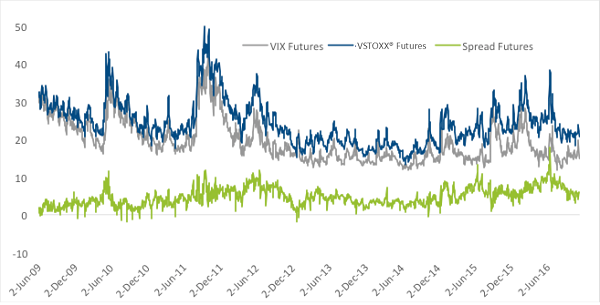
Chart 4: Daily prices of VSTOXX® Futures, VIX futures and VSTOXX® Futures/VIX futures spread 2 June 2009 to 9 November 2016
Source: Bloomberg data
27 April 2010 Standard and Poor’s downgraded the Greek debt to junk and downgraded the sovereign debt of Portugal. It was only a few weeks earlier the Greek debt was previously downgraded[i]. As this occurred both volatility indexes rallied, but VSTOXX® Futures lead the way and maintained a widening premium over VIX futures causing the spread to go from 2.72 on 21 April 2010 to exceed a spread price of 10 by 7 May 2010.
A spread price in the teens is considered a tail event and usually is difficult for that price to be sustained for an extended period of time (as noted in Table 2). In Chart 5 the price traded in a range around 10 to a range around 5 a few times before finally narrowing. By 19 May 2010 the volatility indexes peaked and began a slow decline into the summer months. And the spread also declined into early July.

Chart 5: Daily prices of VSTOXX® Futures, VIX Futures and VSTOXX® Futures/VIX Futures spread Jan to July 2010
Source: Bloomberg
In the spring/ early summer of 2015 the spread was gradually widening (Chart 6) due to rumors of controls on the Greek banks. During this time VIX futures remained stable hovering around 15 while VSTOXX® Futures traded both higher and lower due to the increased European uncertainty. This triggered the VSTOXX®/VIX spread to widen and narrow.
Monday 24 August 2015 the Dow Jones Industrial Average opened 1,000 points lower. The declining U.S. equity markets triggered a decline in global equity markets and rallying of volatility indexes. The VSTOXX® Futures/VIX futures spread came close to going negative at 0.925 on 25 August 2015. The price of the spot spread actually did go negative at -2.3715. This narrowing of the spread may be attributed to the VIX futures rallying faster than VSTOXX® Futures. As noted in Table 2 the futures spread price is negative 0.7 percent of the time. Only 11 percent of the time is the futures spread priced below 2. The price didn’t remain low for long. By 2 September 2015, the spread price rallied above 5 as VIX futures declined faster than VSTOXX® Futures.

Chart 6: Daily prices of VSTOXX® Futures, VIX futures and VSTOXX® Futures/VIX futures spread 3 March 2015 to 31 December 2015
Source: Bloomberg data
One of the top trending words in 2016 was “Brexit”[ii]. Brexit, a referendum on 23 June 2016 to determine if U.K. citizens wanted to leave the European Union was forecasted by polls and betting sites to stay in the EU. In April and May 2016, VIX futures remained relatively stable in the range of 15 to 17. However VSTOXX® Futures traded in the range of the low 20s to the high 20s. As time moved closer to the day of election, the VSTOXX® Futures/VIX futures spread gradually widened as VSTOXX® Futures moved higher.
VSTOXX® Futures peaked 15 June 2016 at 37.62. The spread also peaked at 17.72. Once the votes were cast, the result was to leave the EU; a surprise to many. The equity markets reacted with fast declines. As both volatility indexes rallied, the spread remained capped in the 8 to 10 range. The downside volatility diminished after the initial sell off and both volatility indexes gradually moved lower and the spread narrowed.
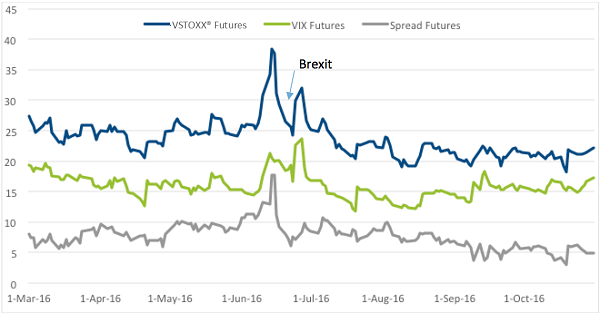
Chart 7: Daily prices of VSTOXX® Futures, VIX futures and VSTOXX® Futures/VIX futures spread 1 March 2016 to 31 October 2016
Source: Bloomberg data
In discussing the VSTOXX®/VIX futures spread, there is a mechanical component that has to be derived to determine how many futures contracts need to be entered for each leg of the spread. There is a difference in the size of the two futures contracts. One volatility point in VSTOXX® Futures = €100[iii]. Whereas, one volatility point in VIX futures = $1,000[iv]. Without adjusting for foreign exchange differentials, a VSTOXX® Futures contract value is 1/10 the size of a VIX futures contract.
Table 3 calculates the ratio of how many VSTOXX® Futures contracts are needed for the spread per each VIX futures contract and adjusting for foreign exchange. For example if EUR and USD were at par, the ratio would be 10 VSTOXX® Futures contracts are required for each VIX futures contract in the spread. As the USD appreciates versus the EUR, the ratio increases. As the USD depreciates versus the EUR the ratio of VSTOXX® Futures contracts needed per each VIX futures contract decreases.
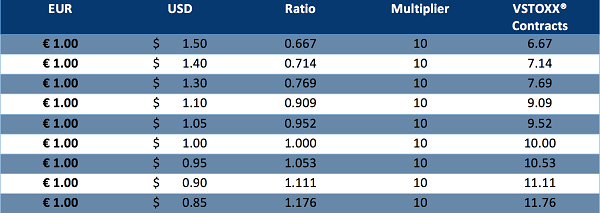
Table 3: Conversion ratio of the number of VSTOXX® Futures to VIX futures
Source: Shore Capital Research LLC
In summary, VSTOXX®/VIX spread tends to maintain similar characteristics from one macro volatility event to the next. A spread price below 2 is considered support and may offer opportunities to buy the spread or unwind a short spread with the exception of the financial crisis. When the spread is priced in the high single digits or higher it is considered resistance and may be an opportunity to sell the spread or unwind a long position. Often the spread will move higher as VSTOXX® Futures leads the rally of the two volatility indexes. Analyzing how the VSTOXX®/VIX spread behaves during macro volatility events may offer some insight for future macro volatility events.
[i] http://money.cnn.com/2010/04/27/news/international/Greece_debt_downgraded/index.htm
[ii] https://www.google.com/trends/explore?q=brexit
[iii]http://www.eurexchange.com/blob/269082/3860c6d6df82b8b2e42b46ef02043a49/data/factsheet_eurex_vstoxx_derivatives.pdf
[iv] http://cfe.cboe.com/products/spec_vix.aspx
By Mark Shore, Founder www.shorecapmgmt.com
Mark Shore has more than 25 years of experience in the futures markets and managed futures, publishes research, consults on alternative investments and conducts educational workshops. His research is found at www.shorecapmgmt.com.
Mr. Shore is also an Adjunct Professor at DePaul University's Kellstadt Graduate School of Business where he teaches a graduate level managed futures/ global macro course. He is board member of the Arditti Center for Risk Management at DePaul Univeristy. Mr. Shore is a frequent speaker at alternative investment events. He is a contributing writer for Eurex Exchange, Reuters HedgeWorld, the CBOE Futures Exchange (CFE) and Micro-Cap Review.
Prior to founding Shore Capital, Mr. Shore was Head of Risk for Octane Research Inc ($1.1 billion AUM) in NYC, where he was responsible for quantitative risk management analysis and due diligence of Fund of Funds. He chaired the Risk Management Committee and was a voting member of the Investment Committee.
Prior to joining Octane, he was the Chief Operating Officer of VK Capital Inc, a wholly owned Commodity Trading Advisor unit ($250 million AUM) of Morgan Stanley. Mr. Shore provided research and risk management expertise on portfolio construction, product development and business strategy. Mr. Shore graduated from DePaul University with a degree in Finance. He received his MBA from the University of Chicago.
Past performance is not necessarily indicative of future results. There is risk of loss when investing in futures and options. Futures can be a volatile and risky investment; only use appropriate risk capital; this investment is not for everyone. The opinions expressed are solely those of the author and are only for educational purposes. Please talk to your financial advisor before making any investment decisions.