Nov 05, 2013
Forward curves of European and U.S. volatility index futures
In our last article Spreading European and U.S. volatility index futures, we discussed various points of how investors and traders could utilize spread positions between VSTOXX® Futures contracts traded at Eurex Exchange and VIX futures as a volatility index spread strategy. We thought it was logical to next examine the forward curves or term structures of these two volatility derivatives for similarities and differences with the goal of revealing potential trading opportunities between the two.
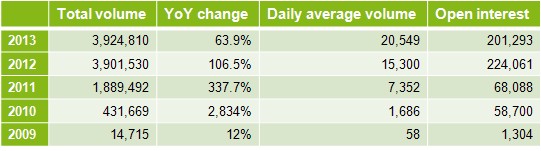
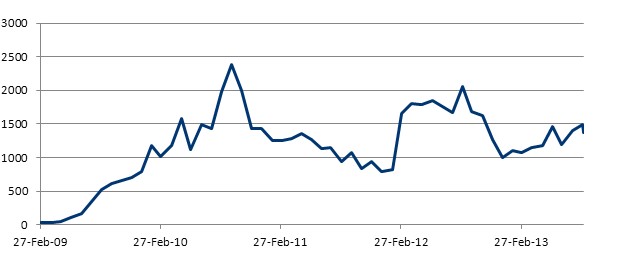
For investors and traders liquidity is always an important component for trading a market. The liquidity of VSTOXX® Futures continues to increase as noted in Table 1.
To examine the term structures of VSTOXX® Futures and VIX futures, we looked at the average term structure of the two products under the following conditions to determine if the term structure of each changes in different market environments.
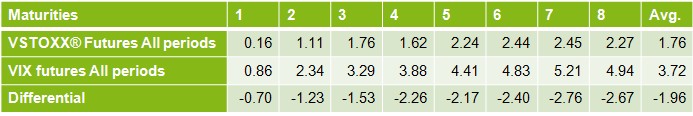
- All periods: We compared the term structures across all market environments of both products from the inception of VSTOXX® Futures on 5 June 2009 to 6 September 2013.
- High market volatility: This is defined when VIX = or > 24 in the spot, front month or nearby month.
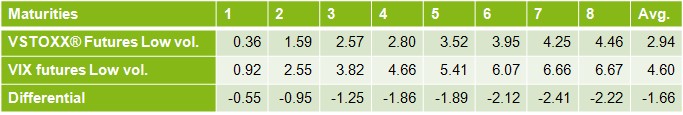
- Low market volatility: This is defined when VIX < 24 in the spot, front and nearby months.
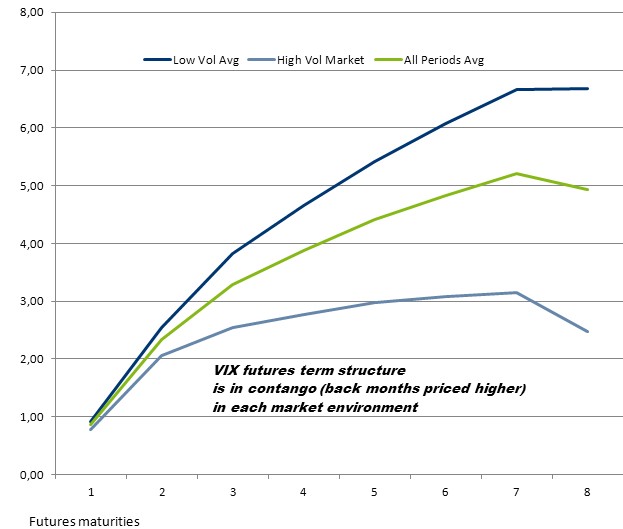
The data in the chart 1 demonstrates the VIX futures tend to have a steeper term structure in less volatile periods and a flatter structure in more volatile periods. On average the term structure trades at a premium to the spot price or better known as contango. Keep in mind the curve may not always be in contango, sometimes it may be in backwardation where the spot price is higher than the futures price.
A flatter curve in high volatility environments may be due to more buying in the front month during the high volatility periods and perhaps more selling in the back months with the idea of volatility reducing in the future. Or at least, the greater focus on the front month due to the volatility at that moment. On average, the front month relative to spot tends to remain in the 0.86 to 0.92 range premium to spot in all three periods tested.
During this period we found the first three months of VIX futures to be in backwardation 5.32% of the time in all periods, 9.30% of the time in high volatility periods and 1.41% of the time in low volatility periods. This supports the observation of a flatter term structure in high volatility periods.
A contango or backwardation market is a topic onto itself, but for now we can say when one is long a futures market and rolling from one maturity month to the next, contango causes negative roll yield. Backwardation causes positive roll yield. This is a topic that impacts the returns of ETNs and ETFs with either costs or added revenue.
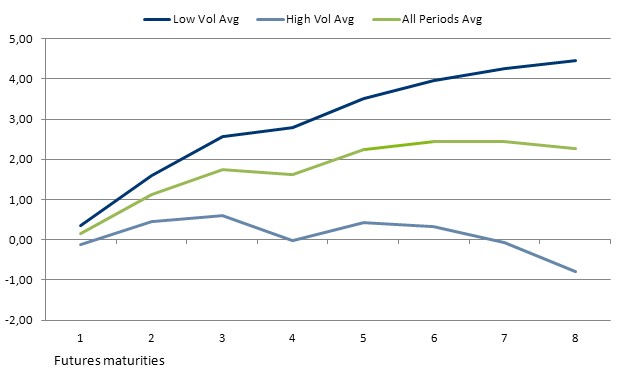
In the period tested, the first three months of VSTOXX® Futures were in backwardation 15.41% of the time in all periods, 27.59% of the time in high volatility periods and 5.97% of the time in low volatility periods. These percentages support the argument of the term structure of VSTOXX® Futures relative to VIX futures to be generally less steep and a higher frequency of leaning toward backwardation. Therefore the VSTOXX® Futures roll yield could be less costly and possibly creating some positive yield at times of positions rolling from one futures maturity to the next.
Chart 3 demonstrates the VIX futures forward curve tends to remain steeper than VSTOXX® Futures forward curve in all three periods.
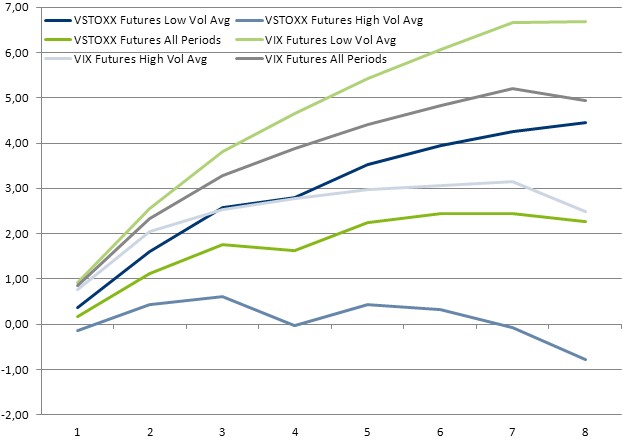
On initial examination, the VIX futures low volatility term structure is the steepest in absolute terms. However, when digging deeper into the analysis, the differential between VSTOXX® Futures term structure and the VIX futures term structure is actually greater during high volatility periods as noted in the following tables.
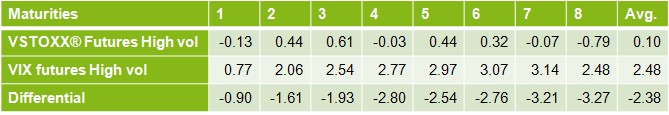
Although the VIX futures front month tends to be lower than the other two periods, the differential between the VIX futures term structure and the VSTOXX® Futures term structure actually widens. The average differential between the two structures is the highest of the three periods with -2.38. For purposes of the front end of the term structure (first three months), the average would be -1.48.
Potential trade idea
As noted in the last article, correlation of the VSTOXX® spot and VIX spot tends to range between 0.2 and 0.8 basis a 20 day rolling correlation. If long positions in VIX futures are more expensive to enter due to cost of carry of its term structure during high volatility periods, then a less expensive method could be to utilize exposure to VSTOXX® Futures or at least some portion of the allocation to volatility futures could be given to VSTOXX® Futures to reduce the cost of carry.
This analysis brings up one more question: Volatility ETNs are rolling an estimated 1/20 of their position each day from the front month to the nearby month to maintain the weighted average maturity of a 30 day forward. Since VIX futures have more assets in their ETN (VXX), would this have an impact on the steepness of the VIX futures term structure?
Periods of low volatility (which tend to last longer than high volatility periods), increases the probability for negative volatility (falling equity prices) in the longer dated maturities and causing the back months to remain at higher prices relative to the shorted dated maturities. This logic builds the argument for volatility futures to be naturally biased towards a contango term structure as demonstrated in Chart 3.
As the ETNs increase in assets, one could argue they offer daily selling pressure on the front month and daily buying pressure on the nearby month. Overtime this pressure may assist the sustainability of contango. VXX began trading on 1 February 2009 with assets of USD 26.9 million and by early September 2013 the assets increased to a range of around USD 1.4 billion. The VSTOXX® ETN (VSXX.L) assets are approximately GBP 21.15 million . In 2012, it was estimated aggregate assets of all VSTOXX® related exchange traded products equated to about USD 300 million.
The growing popularity of volatility products begs the question: If assets of the ETNs are growing and volume of the underlying futures product is simultaneously growing, would the daily rolling of the ETNs have a large impact on the shape of the underlying term structure. Knowing how many contracts an ETN holds is the most efficient method to test for impact. However, this data is difficult to determine.
To determine if there was any impact of the VXX on the term structure we first tested the structure one year prior to inception of the ETN and one year after to see if the structure changed.
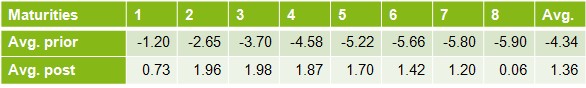
- The prior year experienced the first three maturity months in backwardation 35% of the time. This was also the height of the financial crisis and the market was in high volatility 67% of the time. The very extreme moments of large backwardation in the last four months of 2008 skewed the averages.
- The post year experienced the first three months in backwardation 13% of the time. High volatility periods occurred 96% of the time.
In summary, the term structure of the VIX futures tends to be steeper than the VSTOXX® Futures. In absolute terms on average, the low volatility periods are when the term structures are the steepest and in contango. This would make sense as investors are concerned of increasing negative volatility in the future. However, on a relative basis, it is the high volatility period that has the widest differential term structure between the two products. VSTOXX® Futures have a higher probability for backwardation, thus increasing their potential for a positive roll yield and making VSTOXX® Futures potentially cheaper to utilize in high volatility periods.
Although there is some evidence of the ETN impact on the term structure, more research is needed to establish a stronger understanding of the impact due to 1) sideways to declining assets in the VXX. 2) The inception of volatility ETNs occurred during the financial crisis. 3) More information is needed on the position size of ETNs.
The next article will be an interview with a VSTOXX® Futures Market Maker to discuss the use of volatility products in the investment industry.
The author would like to thank John Plamondon for his support on this article.
By Mark Shore, Founder www.shorecapmgmt.com
Mark Shore has more than 25 years of experience in the futures markets and managed futures, publishes research, consults on alternative investments and conducts educational workshops. His research is found at www.shorecapmgmt.com.
Mr. Shore is also an Adjunct Professor at DePaul University's Kellstadt Graduate School of Business where he teaches a graduate level managed futures/ global macro course. He is board member of the Arditti Center for Risk Management at DePaul Univeristy. Mr. Shore is a frequent speaker at alternative investment events. He is a contributing writer for Eurex Exchange, Reuters HedgeWorld, the CBOE Futures Exchange (CFE) and Micro-Cap Review.
Prior to founding Shore Capital, Mr. Shore was Head of Risk for Octane Research Inc ($1.1 billion AUM) in NYC, where he was responsible for quantitative risk management analysis and due diligence of Fund of Funds. He chaired the Risk Management Committee and was a voting member of the Investment Committee.
Prior to joining Octane, he was the Chief Operating Officer of VK Capital Inc, a wholly owned Commodity Trading Advisor unit ($250 million AUM) of Morgan Stanley. Mr. Shore provided research and risk management expertise on portfolio construction, product development and business strategy. Mr. Shore graduated from DePaul University with a degree in Finance. He received his MBA from the University of Chicago.
Past performance is not necessarily indicative of future results. There is risk of loss when investing in futures and options. Futures can be a volatile and risky investment; only use appropriate risk capital; this investment is not for everyone. The opinions expressed are solely those of the author and are only for educational purposes. Please talk to your financial advisor before making any investment decisions.