Feb 11, 2026
Eurex
Focus on VSTOXX® Derivatives: January 2026 Recap
European markets opened the year higher, with the STOXX® Europe 600 up 3.25% and the EURO STOXX 50® up 2.79%, besting the US S&P 500 Index, which was up 0.69%.
Despite strong equity markets, implied volatility rose across all indices as the market exited the historically low-volatility holiday period and began focusing on risks ahead.
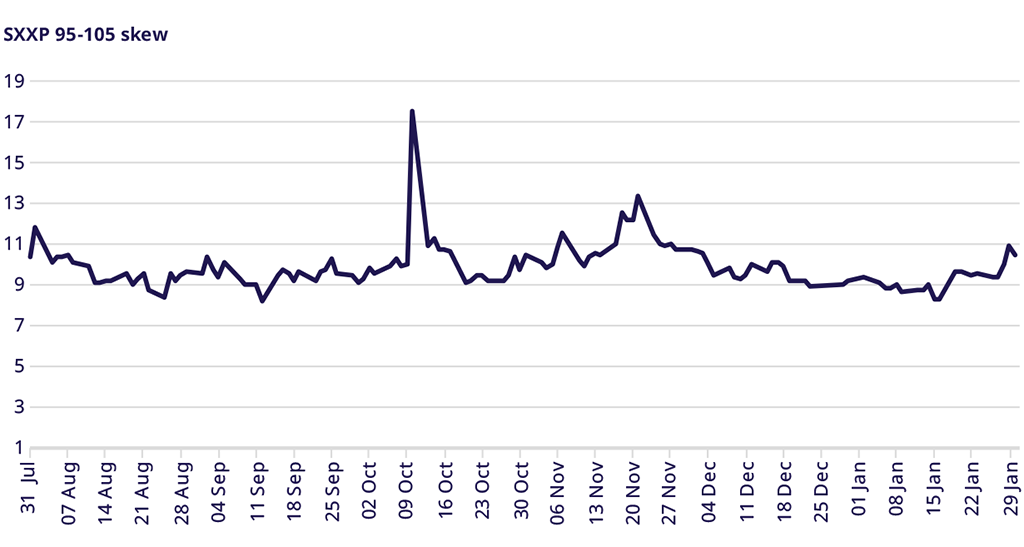
After the January expiration, skew rose to its highest levels since November, suggesting traders might be hedging against geopolitical or idiosyncratic risk into February.
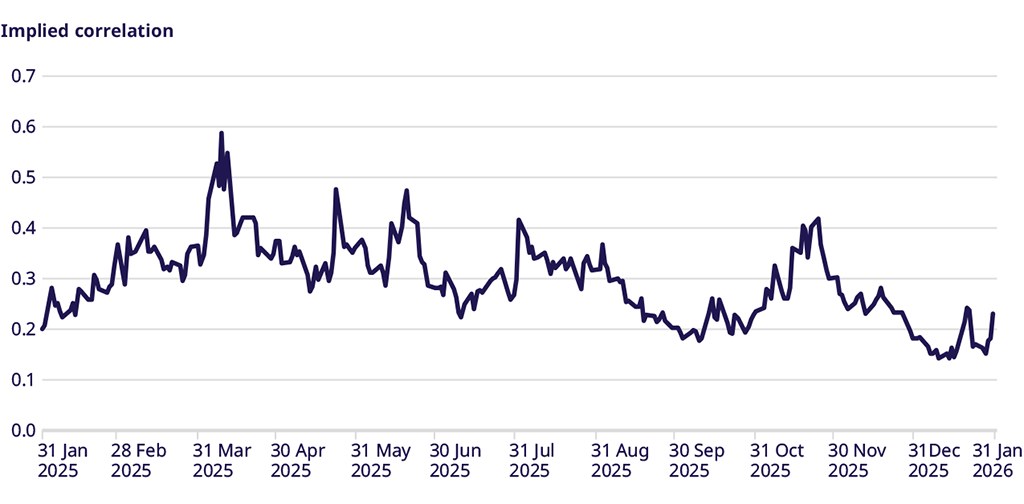
Implied correlation hit a 52-week low in early January, retested that level mid-month, then began to normalize and closed near the month's highs.
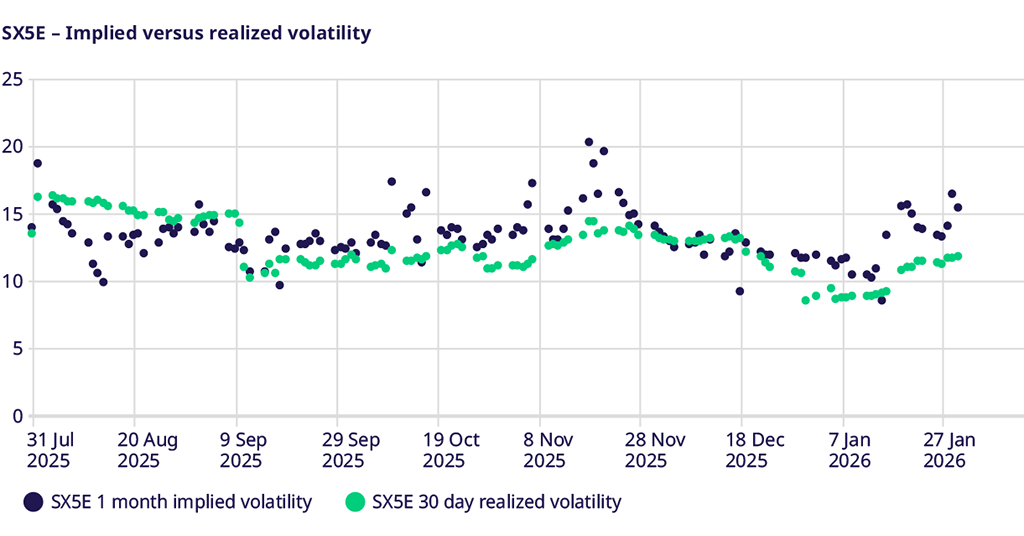
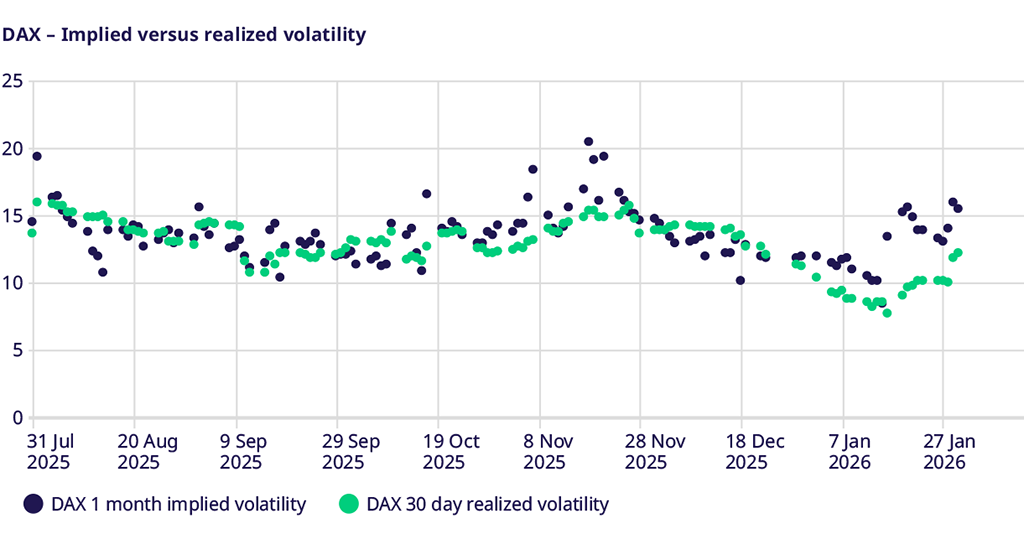
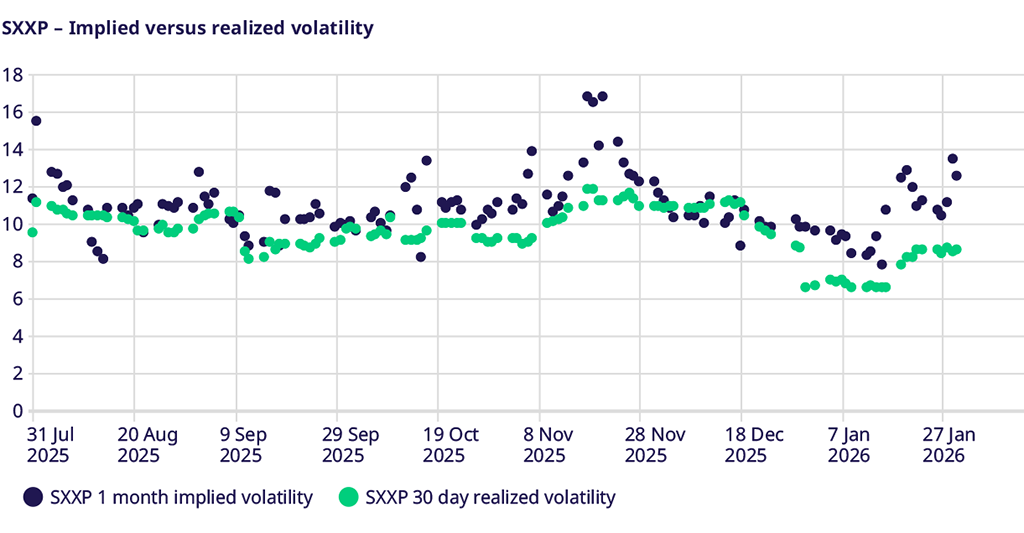
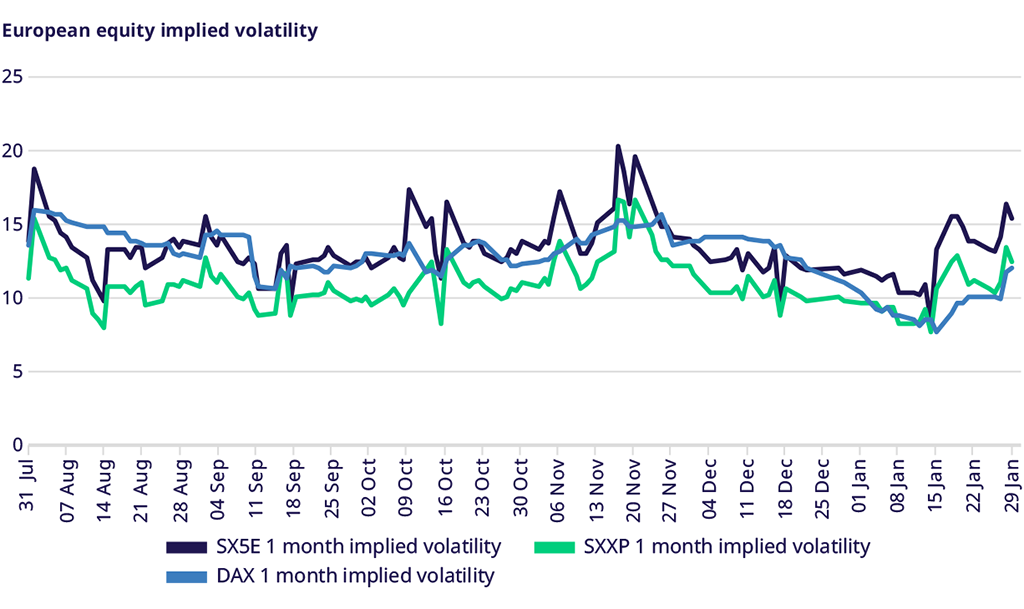
Equity Index Volatility
The EURO STOXX 50® implied volatility rose from 11.65 to 15.41 in January, outpacing the move in 30-day realized volatility. The STOXX® Europe 600 followed suit, rising from 9.75 to 12.49; the DAX Index implied volatility rose from 11.90 to 15.46.
While implied volatility rose across the board over the month, implies moved lower into the January expiration, collapsing to the level of realized volatility, then expanded again in the latter half of the month to close near the year's highest levels. Rising geopolitical risk, earnings season, and dislocations in commodity markets are all potential causes.
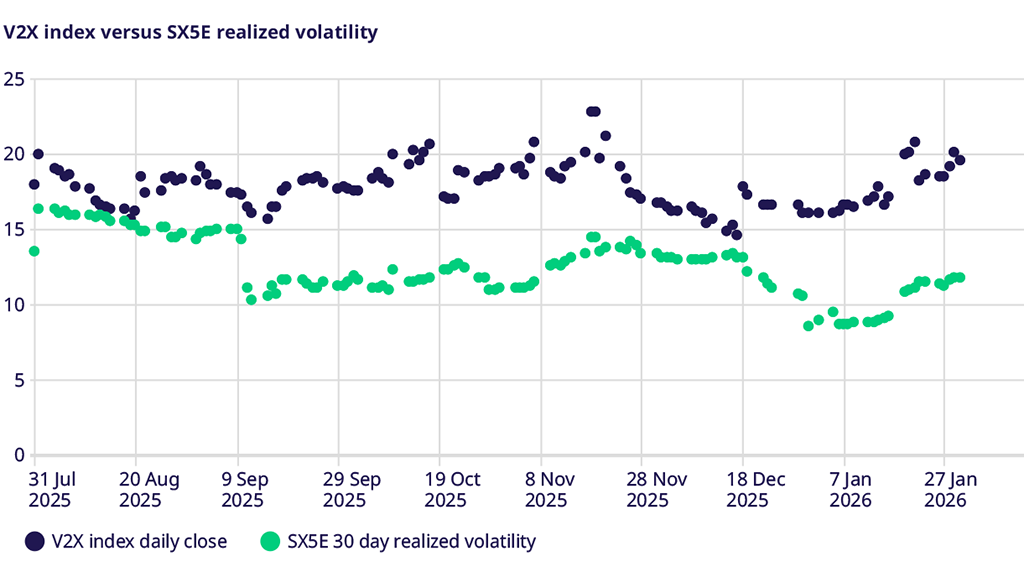
VSTOXX Index Performance
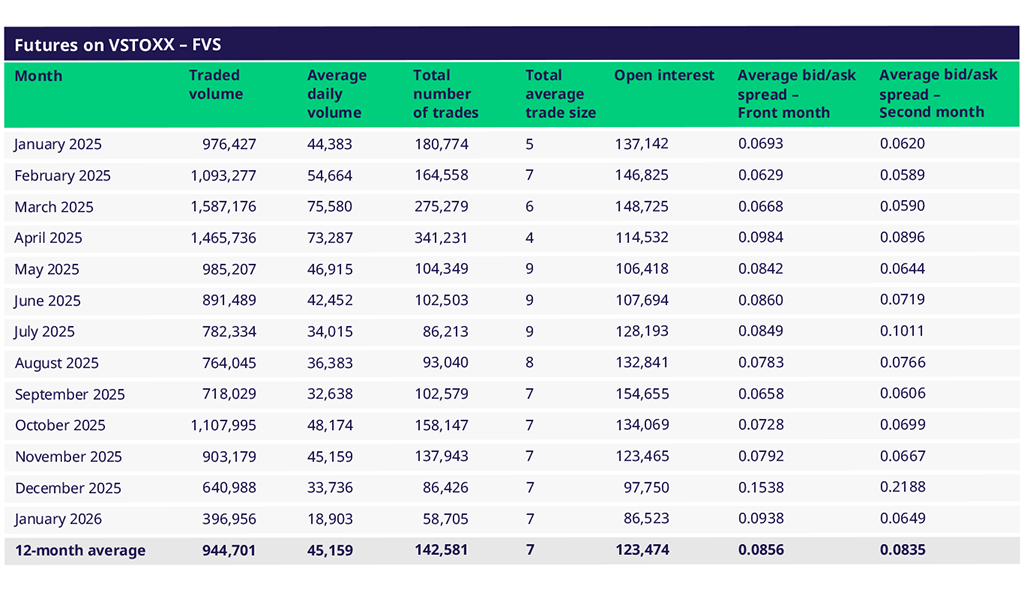
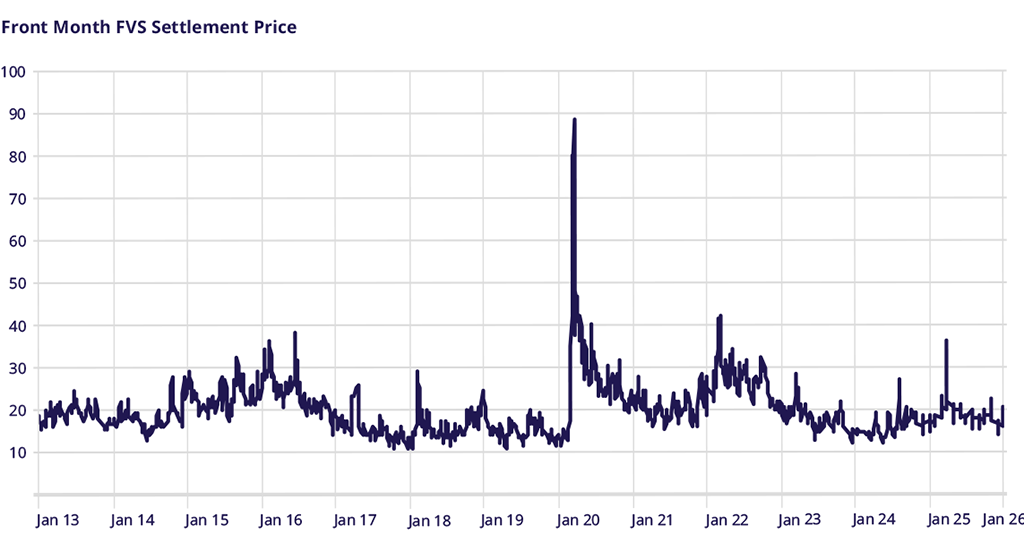
V2X futures stayed roughly constant through the January expiration but then moved higher, closing the month at 19.55, having hit a peak above 20, compared with the December close of 16. The spread between V2X futures and 30-day SX5E realized volatility, a measure of risk premium, stayed roughly constant between 7.5 and 8 volatility points.
While many focus on the absolute level of V2X to discuss complacency or fear, traders focus on this implied volatility premium, as it proxies their ability to profit from gamma-scalping strategies. This implied–realized spread closed the month at 7.8 vol points, well above the sub-2 vol-point observed in December.
STOXX® Europe 600 Index Skew
Skew, measured as the difference between 1-month 95% and 105% implied volatilities, ended the month at 10.4 vol points but hit a low of 8.28 at the January expiration, the lowest level in the past six months. The current skew is consistent with levels last seen in November, before the sharp index rally over the December–January period.
Correlation
Following this theme, implied correlation between single stocks and indexes fell to a 52-week low of 14% at the January expiration, before rising to 23% toward month-end. The current level remains near the lower end of the past six-month range.
Trade the European volatility benchmark
Explore this year's macro events and find an overview of dates.
VSTOXX 101: Understanding Europe’s Volatility Benchmark
Discover the latest STOXX whitepaper today to learn more about the VSTOXX® core methodology, historical performance analysis, and more.
For more information, please visit the website or contact: