Jul 10, 2026
Eurex
Focus on VSTOXX® Derivatives: June 2026 Recap
European markets were mixed in June but generally stronger than global markets with falling commodity prices and the presumed end of the Middle East conflict. EURO STOXX 50® was 4.59 percent, leading the way, followed by STOXX® Europe 600 at 2.51 percent. The DAX® lagged at –0.43 percent, which was more in line with falling US and global markets in June.
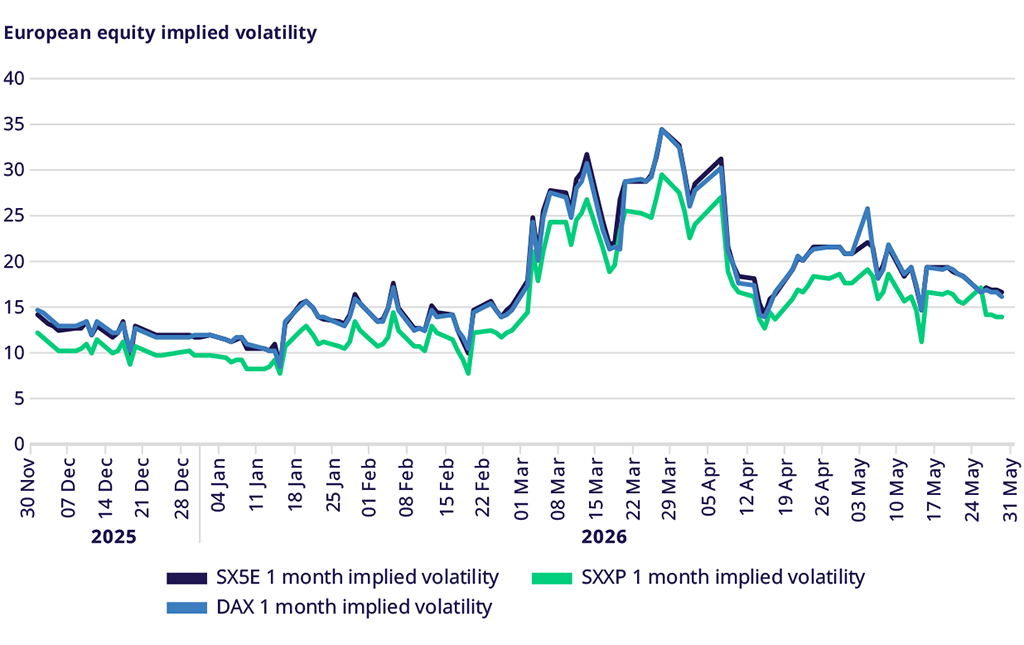
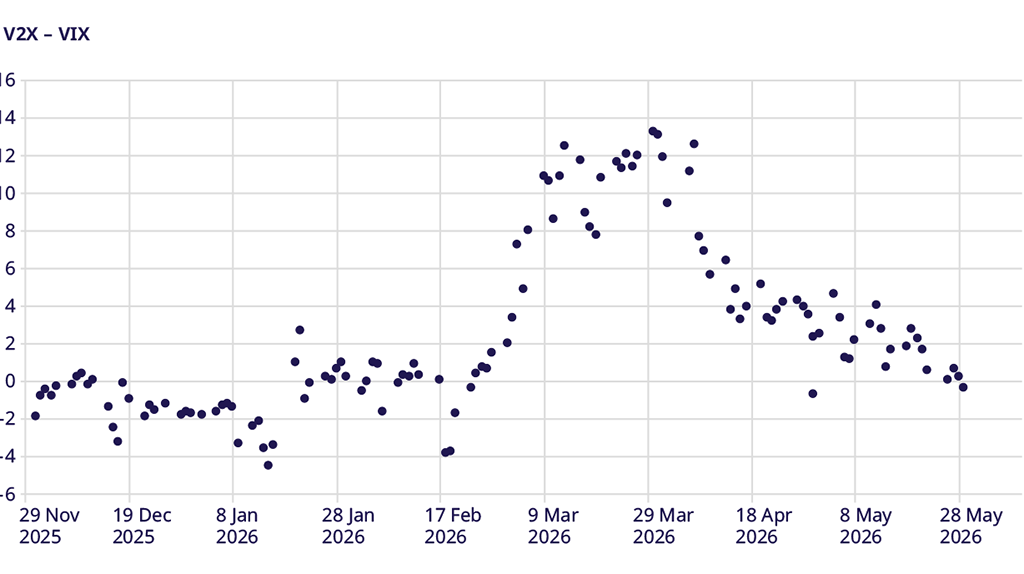
Implied volatility fell across the board with the market pricing geopolitical risk out of markets. In addition, more single-stock/single-theme stories drove the market, meaning the impact on index-level volatility declined. EURO STOXX 50® implied volatility fell by 3 points to 13.68, STOXX® Europe 600 fell by 2.5 points to 11.33, and the DAX® fell by over 2 points to 13.88.
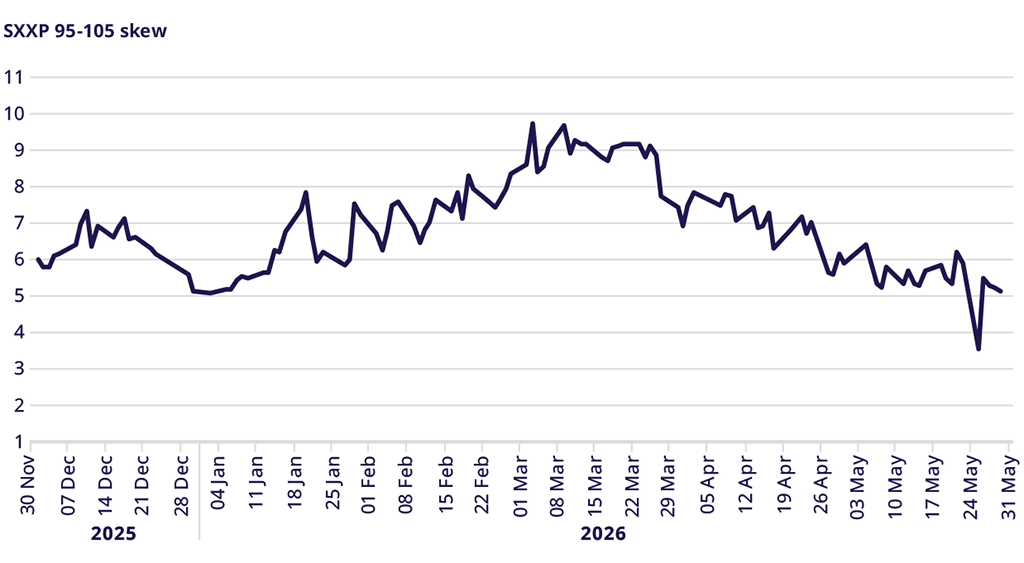
Skew closed the month flat at 5.23 points and remained in a very tight range between 4.7 and 5.99 points. This level is below the long-run mean, which is running at 6.57 volatility points. As investors see less need to hedge, demand for options in portfolios declined.
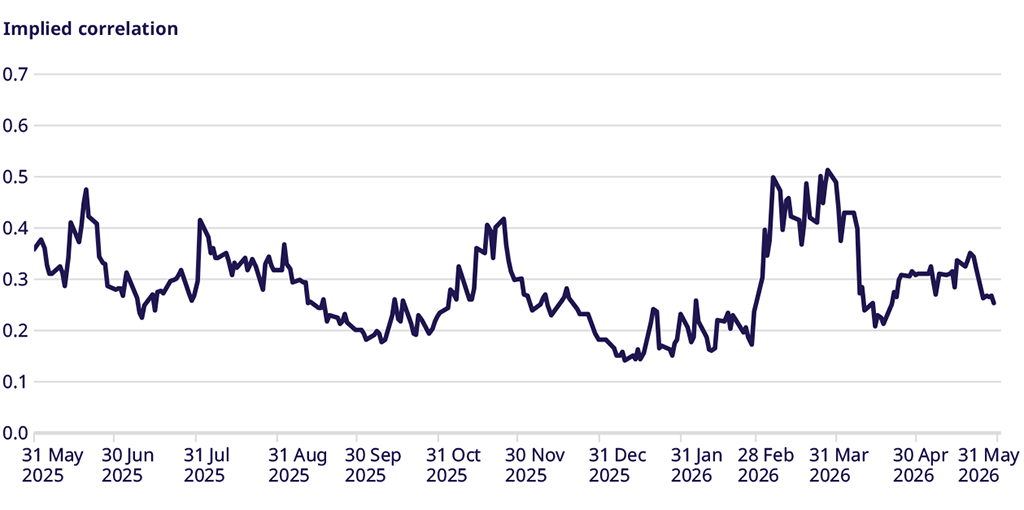
Implied correlation fell over the course of the month to a 52-week low of 0.1305 mid-month in June before recovering modestly to close the month at 0.1353.
Equity Index Volatility
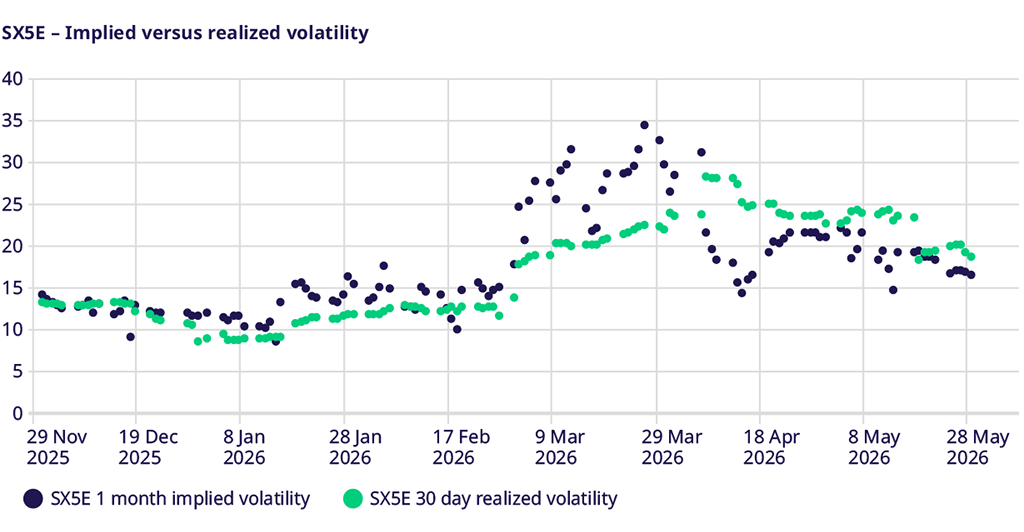
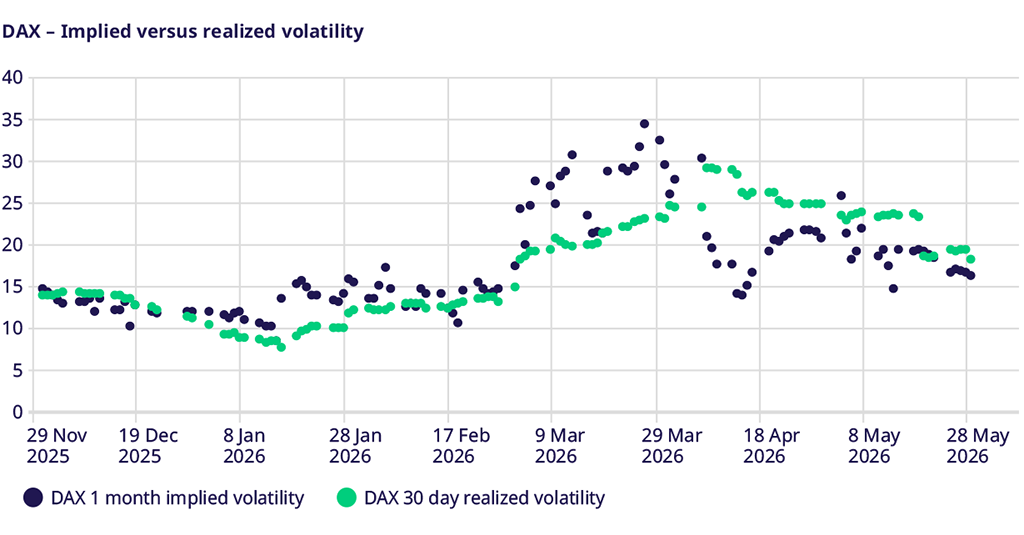
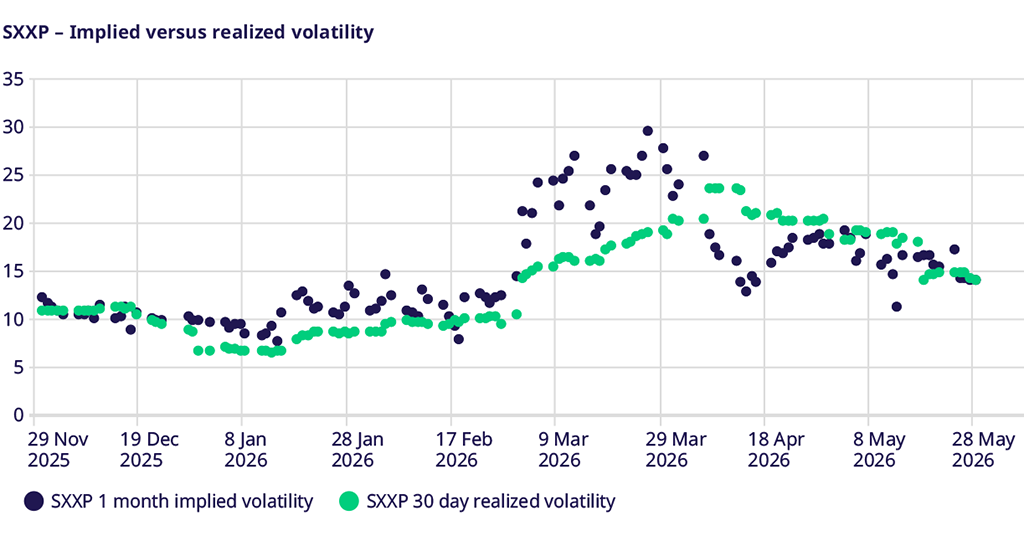
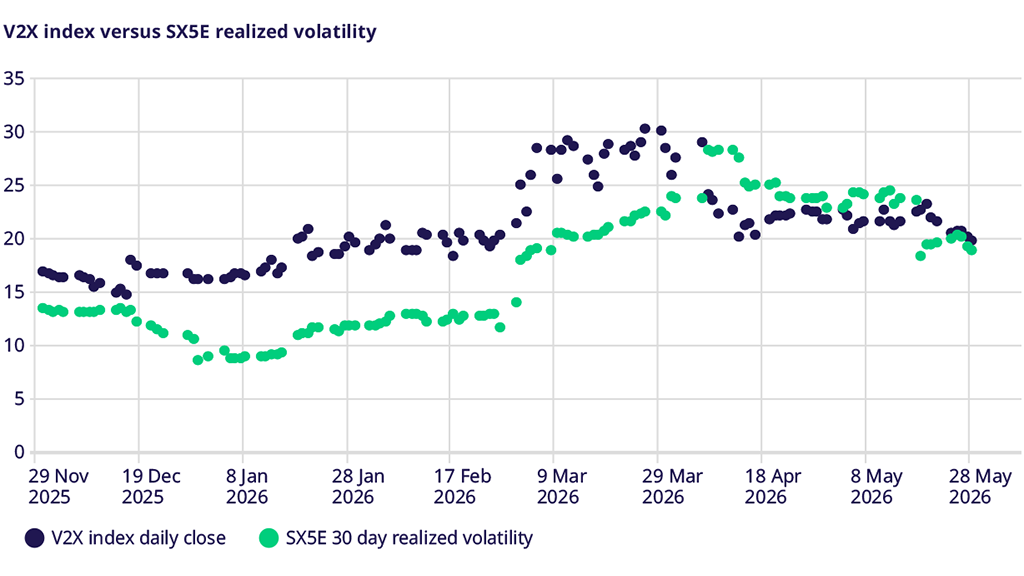
Equity index volatility was lower over the course of June, with falling geopolitical risk and index returns largely flat to stronger. EURO STOXX 50® implied volatility ended at 13.68, vs. 30-day realized volatility of 14.01, a discount that may reflect traders’ higher interest in the World Cup than in gamma scalping their option portfolios. The DAX® index was similar, ending the month at 13.88, vs. 30-day realized volatility of 14.25, another uncommon negative volatility risk premium. STOXX® Europe 600 implied volatility fell to 11.33 but still maintained a volatility risk premium, as the 30-day realized volatility was 10.61.
VSTOXX Index Performance
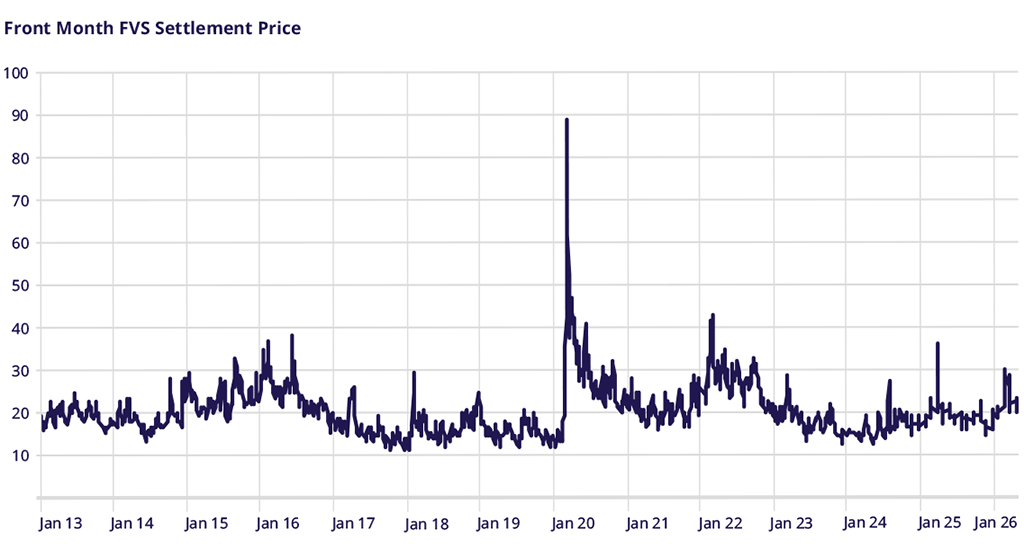
VSTOXX® index levels also fell over the course of June, consistent with other index implied volatility. The magnitude of the fall was lower, however, declining from 19.7 to 17.55. EURO STOXX 50® realized volatility also fell from 18.74 to 14.01. This meant the volatility risk premium in the VSTOXX® actually increased from 0.96 to 3.54, reflecting the preference, perhaps, for convex out-of-the-money options, as the volatility risk premium for at-the-money options compressed, as noted above.
Stoxx Europe 600 Index Skew
STOXX® Europe 600 index skew fell to 5.23 volatility points, below the long-run mean of 6.57 volatility points and back near the lowest levels for a year, which occurred over the holidays and into the start of January. This level was flat for the month, meaning the demand for both 95 percent puts and 105 percent calls declined similarly.
Correlation
Implied correlation hit a 52-week low in June and ended the month near that level at 0.1353. This level is half of the one-year average of 0.2820, further emphasizing the point that investors are focused on single-stock stories rather than the market overall.
Trade the European volatility benchmark
Explore this year's macro events and find an overview of dates.
VSTOXX 101: Understanding Europe’s Volatility Benchmark
Discover the latest STOXX whitepaper today to learn more about the VSTOXX® core methodology, historical performance analysis, and more.
For more information, please visit the website or contact:
