May 30, 2016
Eurex
Colin Bennett on volatility trading. Part 1: The evolution of volatility products
The first in a 3 part series of articles on volatility, this introductory report describes the evolution of the volatility product landscape over time, and the different methods of calculating volatility indexes. Example trades for both volatility futures and options on volatility futures are shown.

About Colin Bennett
Colin Bennett is the author of 'Trading Volatility', the top ranked book on Amazon for volatility. Previously he was a Managing Director and Head of Quantitative and Derivative Strategy at Banco Santander, Head of Delta 1 Research at Barclays Capital, and Head of Convertible and Derivative Research at Dresdner Kleinwort.
Original VIX was based on ATM volatility
The first volatility index was the original S&P100 VIX, which was created by Professor Robert Whaley on behalf of CBOE in 1993 (and back calculated from 1986). Before this date a volatility index was simply an academic concept that had been discussed since 1987. The original VIX was based on S&P100 ATM volatility of: calls and puts; strikes above and below spot; expiry before and after the 22 trading day (c30 calendar days or c1 month) maturity of the index. The calculation methodology therefore uses as an input 8 different ATM implied volatilities, which is reduced to a single VIX value using the below process:
- Average the call and the put implied volatility for options of same strike and expiry. This reduces the 8 original data points to 4.
- Linearly interpolate between the two strikes of options of same expiry to get spot ATM volatility. The 4 data points are therefore reduced to 2.
- Linearly interpolate (or extrapolate if the nearest maturity is within 8 calendar days, as near dated implies, suffer from data quality issues) to get a 22 trading day implied volatility.
Original VIX suffered from launch of variance swaps at the same time
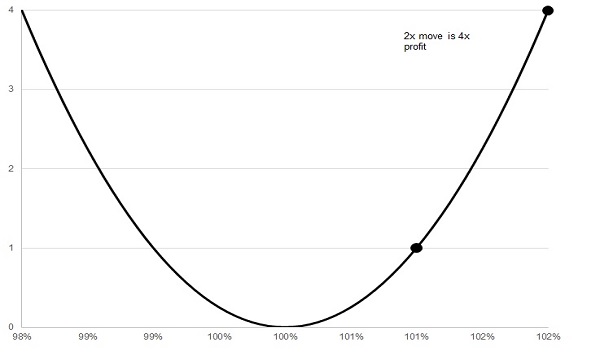
While the original S&P100 VIX was a significant innovation in 1993, the product became almost immediately out-dated as variance swaps were also launched at a similar time. Variance is the square of volatility, which makes variance a difficult concept to understand. However as the pay-out of a delta hedged option is variance, not volatility, variance is mathematically the correct measure of deviation. This can be seen in the diagram below, which shows that a delta hedged option makes 4x the profit when you double the stock price movement. If the payoff of an option was based on volatility, not variance, then a delta hedged option would make 2x the profit when you double the stock price movement.
Volatility Indexes are now usually based on variance
As variance swaps became increasingly popular post-1998 due to the LTCM crisis, it became clear that a volatility index should be based on a variance swap calculation (which uses the implied volatility of all strikes) not an ATM volatility calculation (which only uses the implied volatility of 8 options). A new VIX was therefore launched in 2003 with a variance based calculation, and the underlying changed from the S&P100 to the S&P500. The original S&P100 VIX was renamed VXO. While the majority of volatility indexes use a variance based calculation, there are a few volatility indexes on less liquid indexes (which only have reliable data for ATM options) that continue to use an ATM volatility calculation.
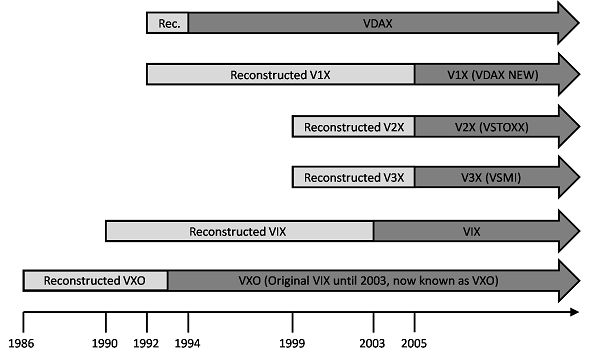
Old VIX, new VIX, VDAX®, New VDAX® and VSTOXX® launch date and first data point
Different index providers use different variants of variance calculation
The major drawback of a variance based calculation is the fact this requires perfectly liquid options for every strike (zero to infinity). To insure the volatility index has a sufficiently high data quality, less liquid OTM options need to be excluded from the calculation. While the calculation of a variance swap is purely mathematical, and therefore impossible to copy-write, each index provider has their own bespoke method of removing illiquid options which is subject to copy-write. For this reason the calculation method of volatility indexes of different providers is slightly different.
Volatiliy indexes are not tradable
The calculation of a volatility index is based on the implied volatility for a fixed number of days, normally 30 calendar days. As listed options are only available for monthly or weekly expiries, for the majority of days a volatility index has to use as an input the implied volatility for two expiries (normally the expiry just before and just after the theoretical expiry of the index). A volatility index is therefore only useful as an indicator of how volatile the market expects the underlying to be. If an investor wants to trade volatility, they have to use an instrument with a fixed expiry such as a volatility future (or an ETN/ETF whose payout is based on volatility futures, like the VSXX1).
Can trade volatility through futures
As a future has a fixed expiration, it can be hedged with a portfolio of options which also have a fixed expiration. This means that market makers are able to offer liquidity on futures on volatility indexes, as they can hedge their risk with ordinary option on the underlying equity (or equity index). The expiration of volatility futures is chosen so at maturity they are 30 days from the ordinary options expiration, as 30 days is the market standard expiration for volatility indexes. Having this non-standard expiration means that market makers only need to hedge most of their volatility risk with one expiry2. This reduces hedging costs which allows them to narrow their bid offer spreads.
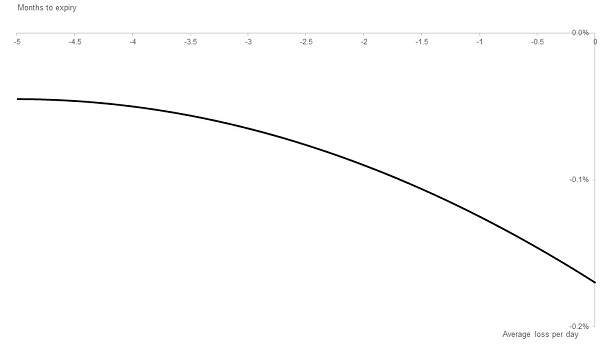
Volatility futures as a hedge should have maturity between 2 and 5 months
As put options are typically used to buy protection, investors typically buy (rather than sell) them. This usually lifts the value of implied volatility above fair value. As a future on a volatility index is based on the implied volatility of options, they are on average expensive. This can be seen from the diagram below, which shows the average daily return for VSTOXX® Futures in the 3 months approaching expiry. As the average daily loss for VSTOXX® Futures between 2 and 5 months or more to expiry is relatively small, this is the optimum maturity for long VSTOXX® strategies. As volatility means reverts over a period of a few months, the sensitivity of VSTOXX® Futures to the VSTOXX® decreases as maturity increases. For this reason, it is not usually wise to trade VSTOXX® Futures of maturity 6 months or more.
Volatility futures can offer cheaper protection than puts when volatility is low
When equity markets plummet, this normally happens with high volatility. Conversely, when equity markets rise they tend to do so gradually with low volatility. This means volatility is negatively correlated to the equity market. A long volatility future position can therefore be used to hedge a long equity position. A portfolio of long volatility futures and long equity should therefore have a low volatility, and hence lower risk of significant negative returns. As volatility is on average expensive, this reduction in risk comes at the expense of a lower average return. However using volatility futures can be a cheaper hedge than buying put options. This is because a put option expires worthless if equities do not decline, while implied volatility is floored and never declines to zero.
Selling volatility earns small profits on average, so needs to be done regularly and with short maturity (1 month)
Investors can therefore profit from selling volatility futures. The disadvantage of this strategy is that while on average small returns are earned, occasionally a large loss is suffered. This strategy could be seen to be similar to selling insurance. Most of the time a small premium is earned, but in the event of an accident a large loss has to be covered. Given the asymmetric risk reward profile of selling volatility futures, it is only seen to be worthwhile if done regularly (in the same way an insurance company sells lots of insurance, and does not do it as a one off). As VSTOXX® Futures suffer on average the largest loss in the final month to expiry (see diagram above), this is the optimum maturity for a short volatility strategy.
Volatility futures can offer higher returns than equity futures
While it is rare for equities to double or halve over periods less than 1 year, it is possible for volatility to double in a few days or halve in periods as short as a month. Investors who have high conviction regarding the direction of markets can consider volatility futures to be a more profitable way of expressing that view. We would caution that with the higher potential reward, there is higher potential risk.
Options on volatility futures also offer volatility exposure
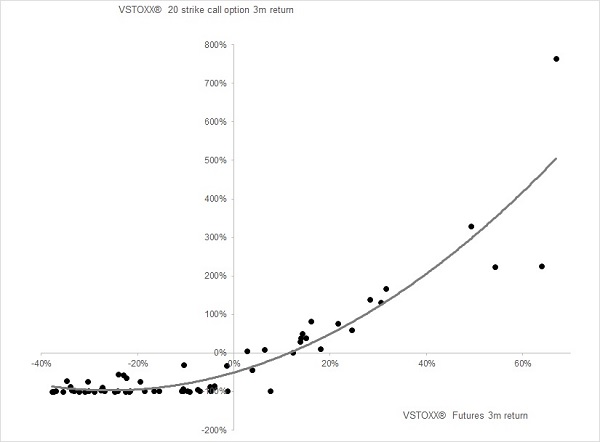
Investors who wish to be long volatility are normally expecting a volatility spike. While volatility futures will be profitable in the event of a volatility spike, call options on volatility could be significantly more profitable as they offer geared exposure to any volatility upside. The chart below shows the 3 months return for VSTOXX® 20 strike (i.e. roughly ATM) call options against the 3 month return for the identical maturity VSTOXX® Future. As can be seen, the profits on a long VSTOXX® call option can be up to 10 times larger than profits on VSTOXX® Futures. This additional exposure to volatility spikes comes at the cost of a far larger average loss (24%) than the average loss on VSTOXX® Futures (6%) over the 3 month period.
Buying puts on volatility futures profits from expensive implied volatility
Options on equity indexes are normally overpriced, and the greater the maturity the more expensive they are on average. Because of this, investors can on average profit through buying put options on volatility futures, particularly when volatility is high (as volatility tends to mean revert, hence if it is high it is likely to decline).
1 The VSXX is the VSTOXX® equivalent of the VIX based VXX
2 As a volatility future is similar to a forward start on volatility (or variance), the position will need to be hedged with two expiries (the main risk from the farthest maturity at the end of the forward start, but also a smaller amount of risk from a nearer dated expiry at the beginning of the forward start).