Apr 10, 2026
Eurex
Focus on VSTOXX® Derivatives: March 2026 Recap
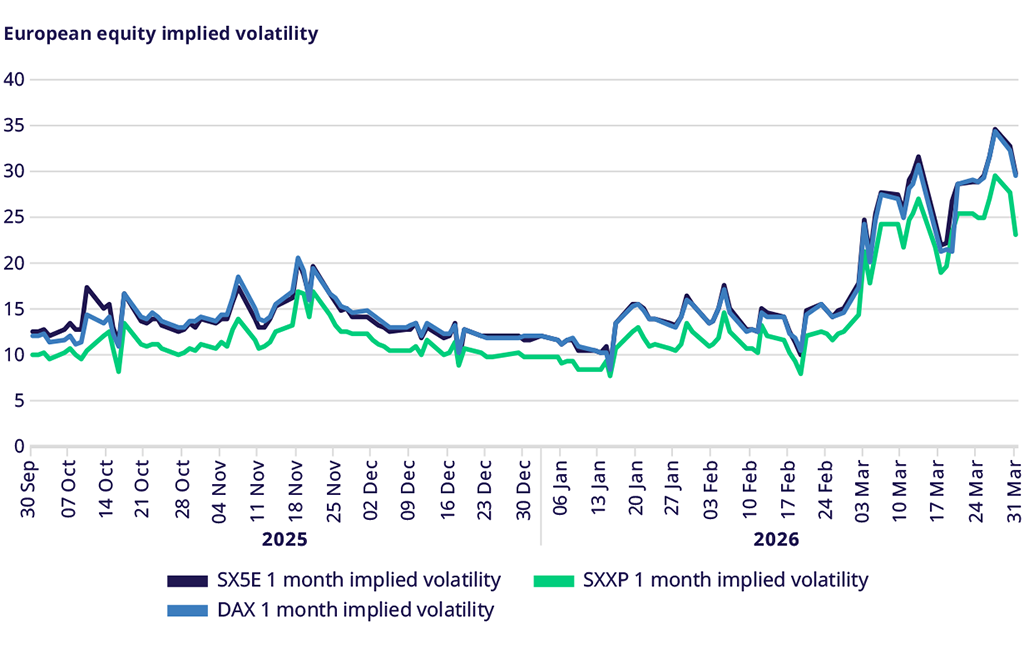
European markets were considerably weaker in March, impacted by the conflict in the Middle East. EURO STOXX 50® fell by 9.26%, STOXX® Europe 600 fell by 8%, and the DAX® fell by 10.3%, all of them underperforming considerably the MSCI World or S&P 500® indexes.
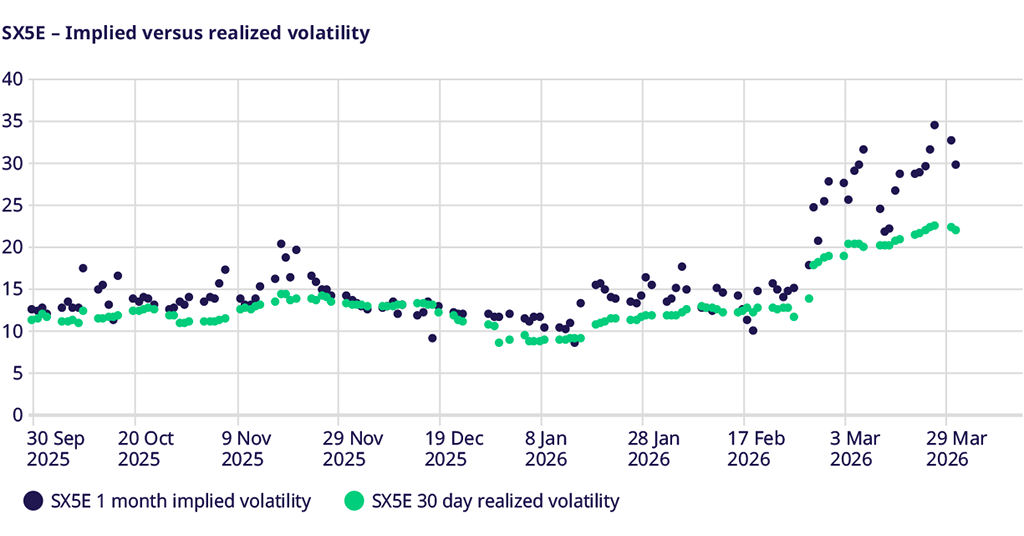
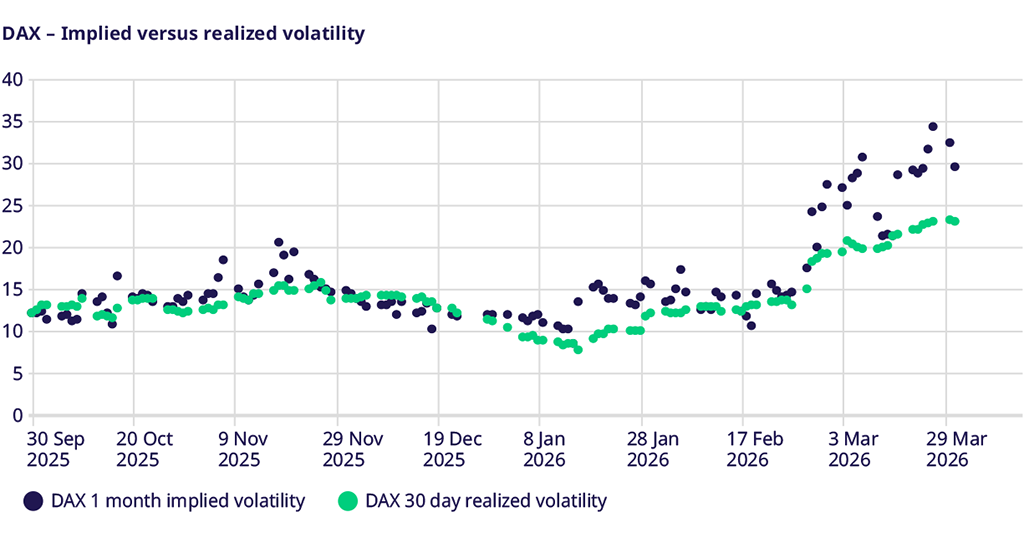
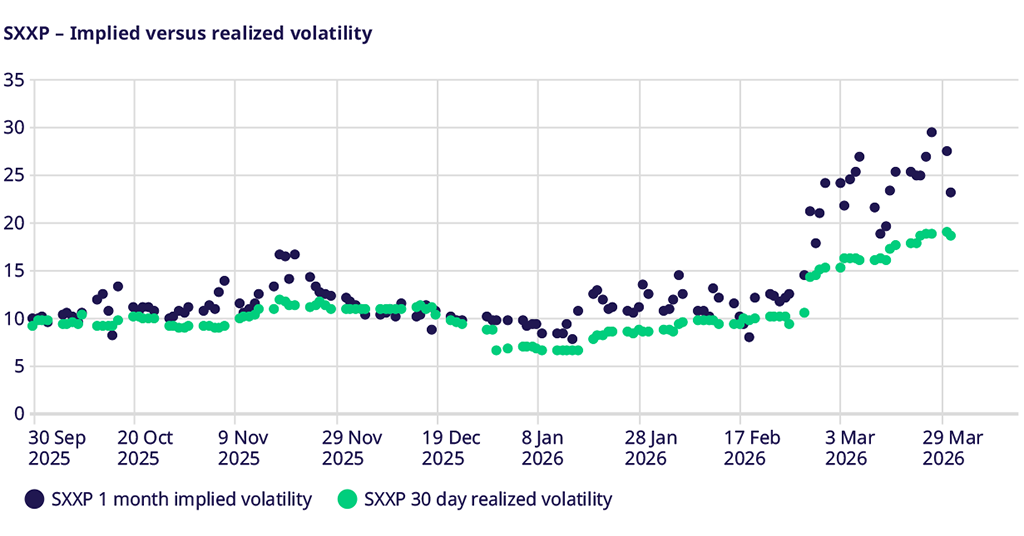
Because of the war risk and the weak equity markets, implied volatility moved higher across the board and increased its risk premium, as measured by the difference between implied and realized volatility.
Skew continued the pattern of firming this year, reaching the highs of the past six months before falling sharply in the last two days of the month - still elevated but not as extreme.
Implied correlation rose from the lows of the past year to near the highs of the last six months, as macro markets tend to be much more highly correlated.
Equity Index Volatility
European equity indices were rocked in March, hit by concerns of economic weakness and high inflation as a result of the spike in commodity prices. Not only did equity volatility move higher as a result of lower equity prices, but the spread between implied and realized volatility- the volatility risk premium - rose as investors looked to the options market for portfolio hedges. EURO STOXX 50® implied volatility rose to almost 30, an 8-vol premium to realized after having hit a 12-vol premium. STOXX® Europe 600 ended the month at 23.08, but only two days earlier was near 30, or a 10-vol premium. DAX® volatility closed at 29.43, a 6.5-vol premium.
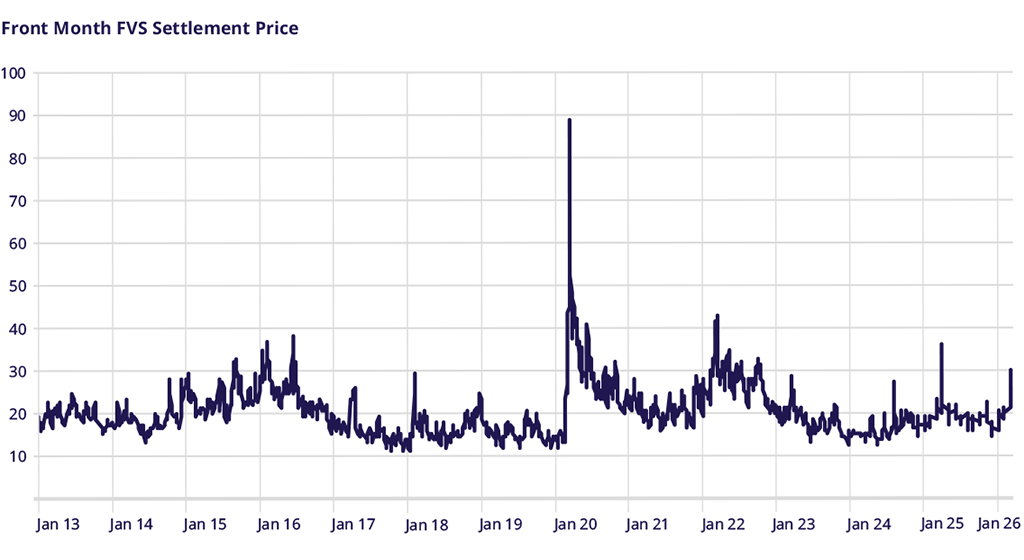
VSTOXX Index Performance
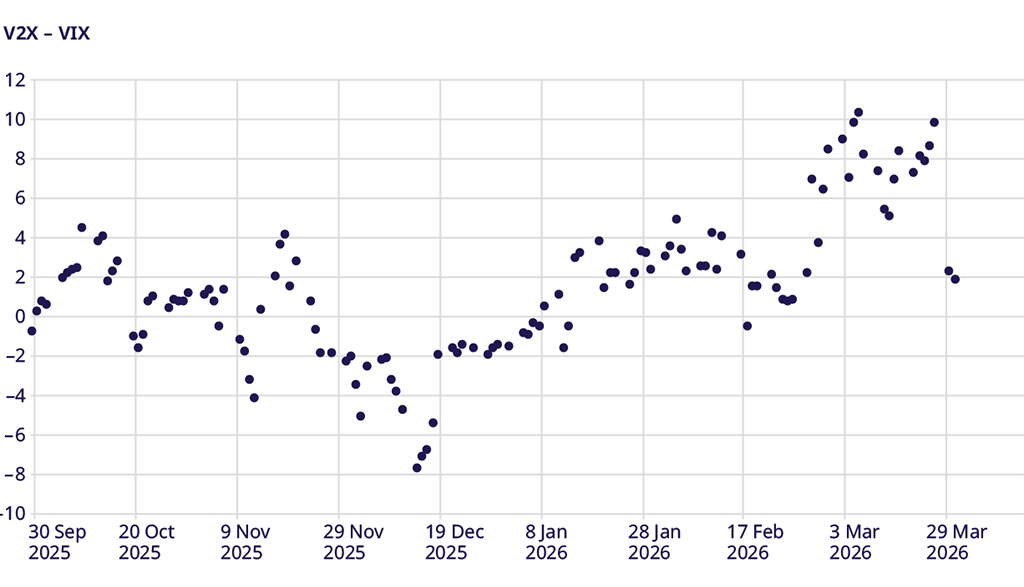
VSTOXX® moved from just over 20 to a high above 30 before closing the month at 28.3, more than a 6-vol premium to EURO STOXX 50® realized volatility. In addition, as Europe was seen as a bigger risk due to the spike in commodity prices - and perhaps given the recent outperformance -the VSTOXX® traded to a 10-vol spread above the VIX® near the end of the month before settling at a 2-vol premium in the last two days, as hopes for a quick end to the war entered the markets.
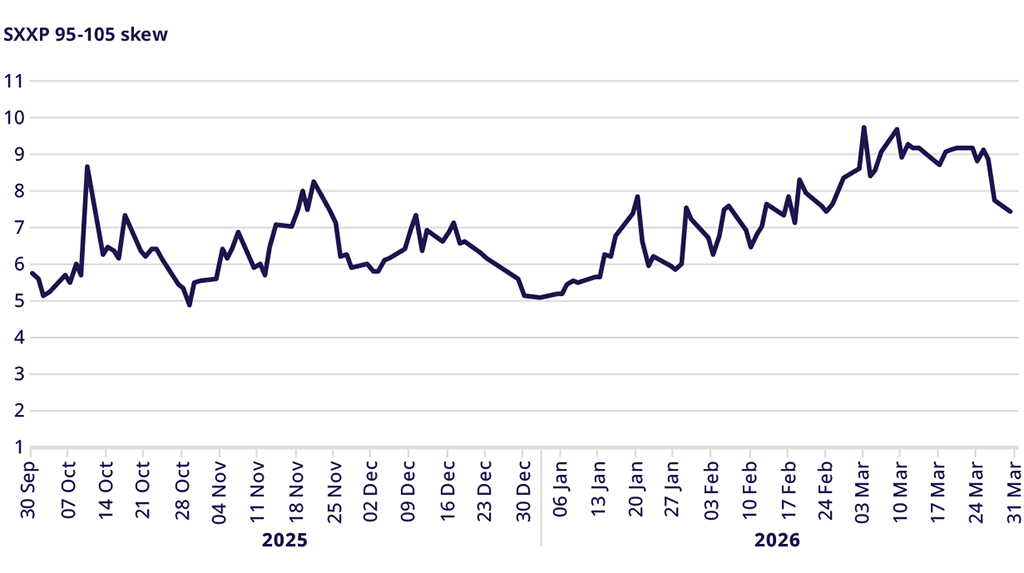
STOXX Europe 600 Index Skew
Skew spent most of the month above 9 vols, hitting a high near 10 vols, before collapsing on the positive sentiment in the last two days and closing lower on the month at 7.4 vols. The combination of widening skew and a wider volatility risk premium indicates that investors were highly active in using options to hedge their portfolios, as insurance costs moved higher throughout the month and improved only when the war news turned more positive.
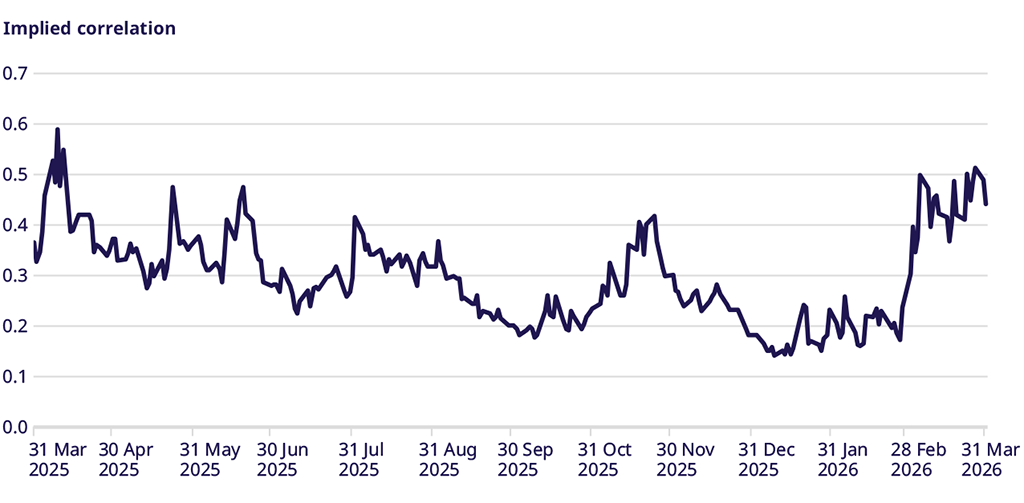
Correlation
Macro markets are correlated markets. With all risk seen as macro-driven, it is not surprising that implied correlation moved higher over the month - from 0.17 to a high of 0.50, the highest level observed since Liberation Day last spring.

Trade the European volatility benchmark
Explore this year's macro events and find an overview of dates.
VSTOXX 101: Understanding Europe’s Volatility Benchmark
Discover the latest STOXX whitepaper today to learn more about the VSTOXX® core methodology, historical performance analysis, and more.
For more information, please visit the website or contact: